Tom Irvine
A phone that slips out of your hand is a shock problem, and a surprisingly rich one. The drop height fixes only one thing, the velocity at impact. Everything that matters after that, the pulse duration, the peak acceleration, and where the stress ends up, is decided by which part of the device touches the ground first. A new Vibrationdata slide set works through the kinematics, the spring-mass idealization, the half-sine pulse relations, the three orientation classes, the standards, the test hardware, and the design responses.
The slides are available here: Drop_Test_Face_Edge_Corner.pptx
A Drop on Live Television

Figure 1. The first iPhone 6 sold, Perth, Australia, 19 September 2014. The buyer dropped it on the pavers during a live TV report while unboxing it.
The deck opens with this event. The phone survived, at least functionally, but it may well have picked up a glass edge flaw or a cracked solder joint that a later drop or a few years of vibration and thermal cycling would finish off. That single uncontrolled fall landed on one corner or edge. A qualification test cannot rely on luck, so it must cover every face, every edge, and every corner. Most original equipment manufacturers specify 30 to 50 drops per device, distributed across orientations, heights, and surfaces.
Free-Fall Kinematics
Neglecting air drag, which is negligible for a phone falling one or two metres, the impact velocity from drop height $h$ is
$$v_0 = \sqrt{2 g h}$$and the kinetic energy per unit mass is simply $g h$. Velocity grows only with the square root of height, so doubling the height raises the impact velocity by 41 percent but doubles the energy that must be stored, dissipated, or converted into rotation.
| Drop height | h (in) | v (m/s) | v (ft/s) | KE/m (J/kg) |
|---|---|---|---|---|
| 0.50 m | 19.7 | 3.13 | 10.3 | 4.9 |
| 0.75 m | 29.5 | 3.84 | 12.6 | 7.4 |
| 1.00 m | 39.4 | 4.43 | 14.5 | 9.8 |
| 1.22 m | 48.0 | 4.89 | 16.0 | 12.0 |
| 1.50 m | 59.1 | 5.42 | 17.8 | 14.7 |
| 1.80 m | 70.9 | 5.94 | 19.5 | 17.7 |
Table 1. Impact velocity and kinetic energy per unit mass versus drop height, g = 9.81 m/s².
A hand-held drop from waist or ear height is 1.0 to 1.5 m. The MIL-STD-810 transit drop for man-portable items is 122 cm, or 48 inches, which gives 4.89 m/s.
The Spring-Mass Model with Initial Velocity
The simplest useful model is a mass $m$ on a contact spring $k$, released with initial velocity $v_0$ and zero initial displacement. The undamped free response is
$$x(t) = \frac{v_0}{\omega_n} \sin(\omega_n t), \qquad \omega_n = \sqrt{k/m}$$so the peak displacement is $v_0/\omega_n$, the peak acceleration is $v_0 \, \omega_n$, and the peak contact force is $v_0 \sqrt{k m}$. The time to peak is one quarter period.
This is the key point of the whole deck. The drop height sets $v_0$, but the peak acceleration is $v_0 \, \omega_n$, and $\omega_n$ is governed by the contact stiffness, which depends on orientation. A face landing on steel is a very stiff contact. A corner landing that crushes a bit of aluminum is a soft one.
For a 1.0 m drop, $v_0 = 4.43$ m/s. Assume a contact mode at 500 Hz, so $\omega_n = 3142$ rad/s. Then the peak displacement is 1.41 mm, the peak acceleration is 13,900 m/s², about 1420 G, and the time to peak is 0.5 ms. In the original Initial Velocity slides, a 36 inch drop with natural frequencies of 200, 600, and 1000 Hz gives a constant peak velocity of 167 in/sec but peak accelerations of 543, 1630, and 2710 G respectively.
Oversimplification. Plastic deformation, rate-dependent contact stiffness, rotation of the body, and multiple impacts are all outside this linear model. It gives scaling, not a design number. For a real device, measurement is usually more productive than analysis.
The 100 in/sec figure is often quoted as a severity threshold, following Gaberson’s work and MIL-STD-810. A drop of only 13 inches reaches it.
Pulse, Velocity Change, and Restitution
The impact pulse is commonly approximated as a half-sine of peak acceleration $A$ and duration $\tau$. The velocity change through the pulse is
$$\Delta v = \frac{2 A \tau}{\pi}$$and with coefficient of restitution $e$ the total velocity change is $\Delta v = (1+e) \, v_0$. A value of $e \approx 0$ is a dead, plastic landing; $e \approx 0.5$ is typical for a phone on concrete; $e \to 1$ is a fully elastic bounce. The area under the pulse is fixed by $\Delta v$, so for a given drop a shorter contact time must mean a higher peak G.
| Duration τ | Peak A (G) |
|---|---|
| 0.25 ms | 4,260 |
| 0.5 ms | 2,130 |
| 1.0 ms | 1,065 |
| 2.0 ms | 532 |
| 5.0 ms | 213 |
| 10 ms | 106 |
Table 2. Half-sine peak acceleration for a 1.0 m drop with e = 0.5, Δv = 6.65 m/s, A = πΔv/(2τ).
Measured phone-on-concrete pulses are typically 0.3 to 2 ms, so peak accelerations from hundreds to several thousand G are normal, not alarming.
Face, Edge, and Corner
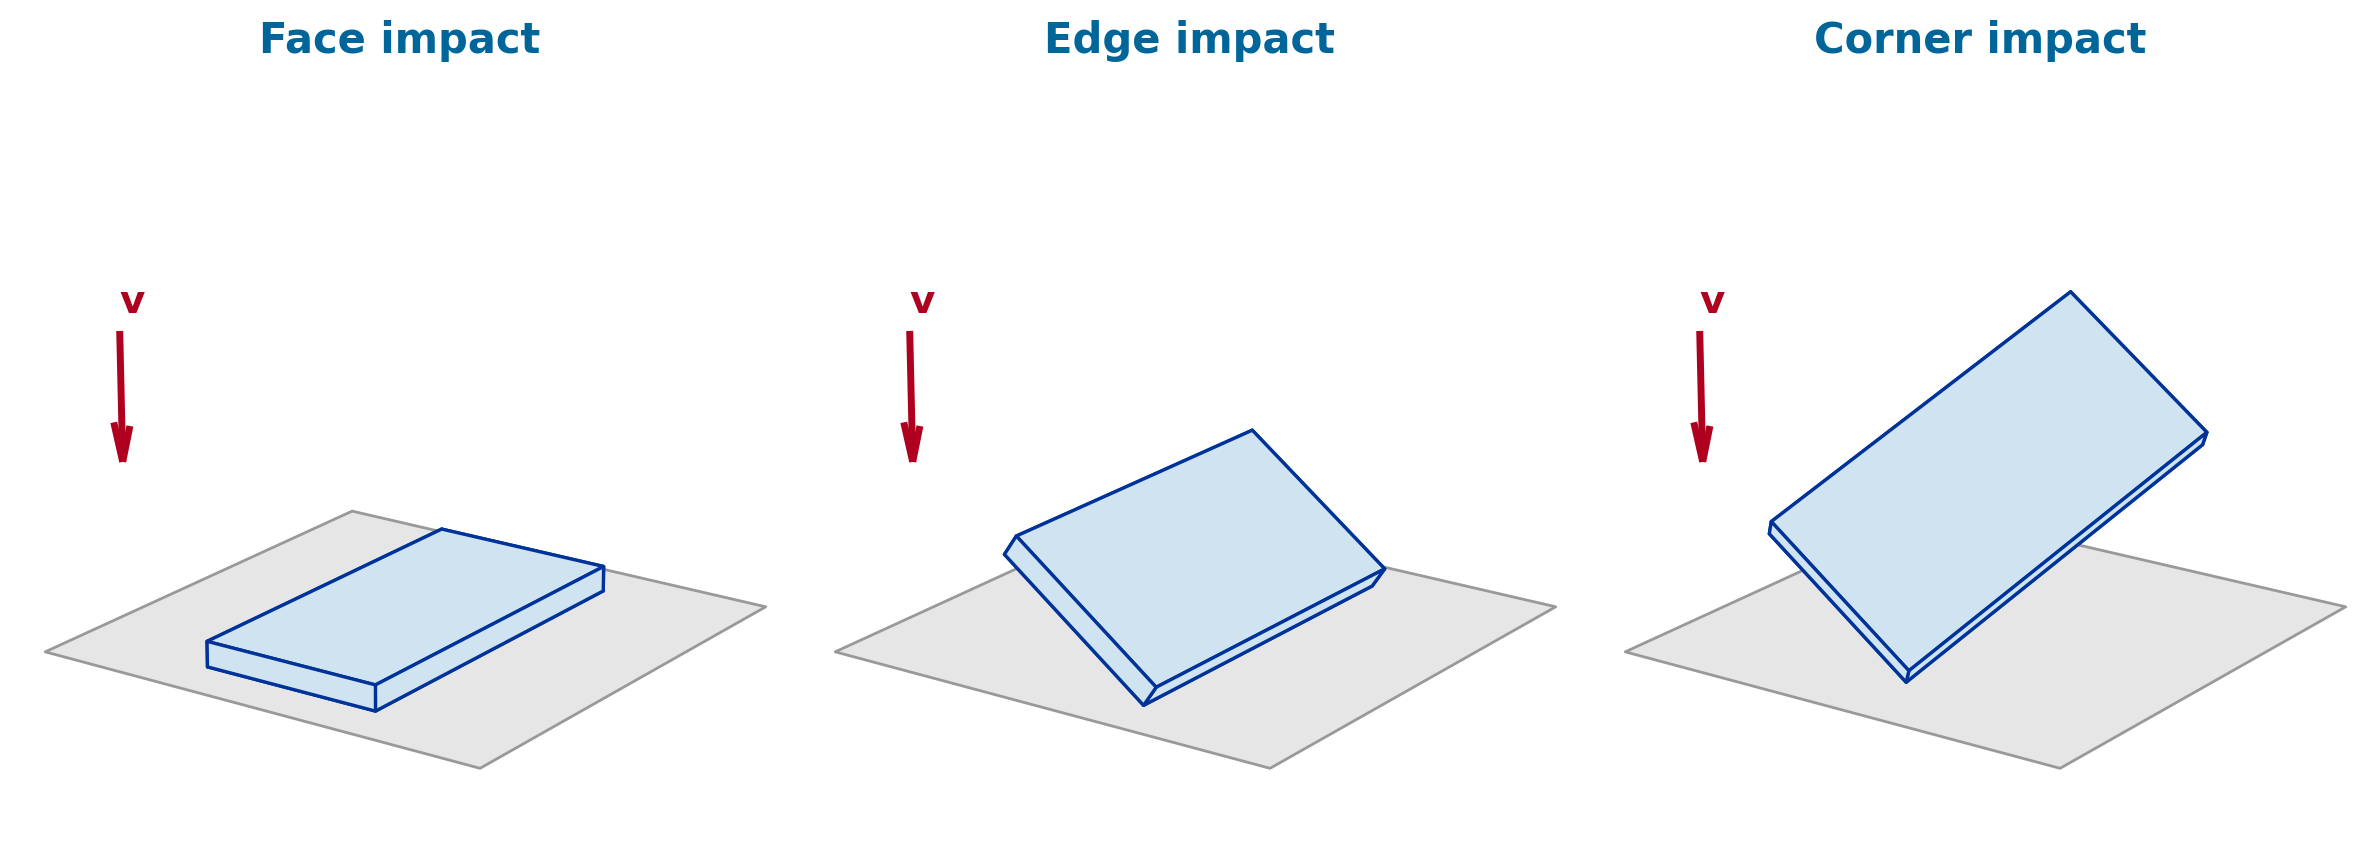
Figure 2. The three orientation classes. The impact velocity is the same in every case.
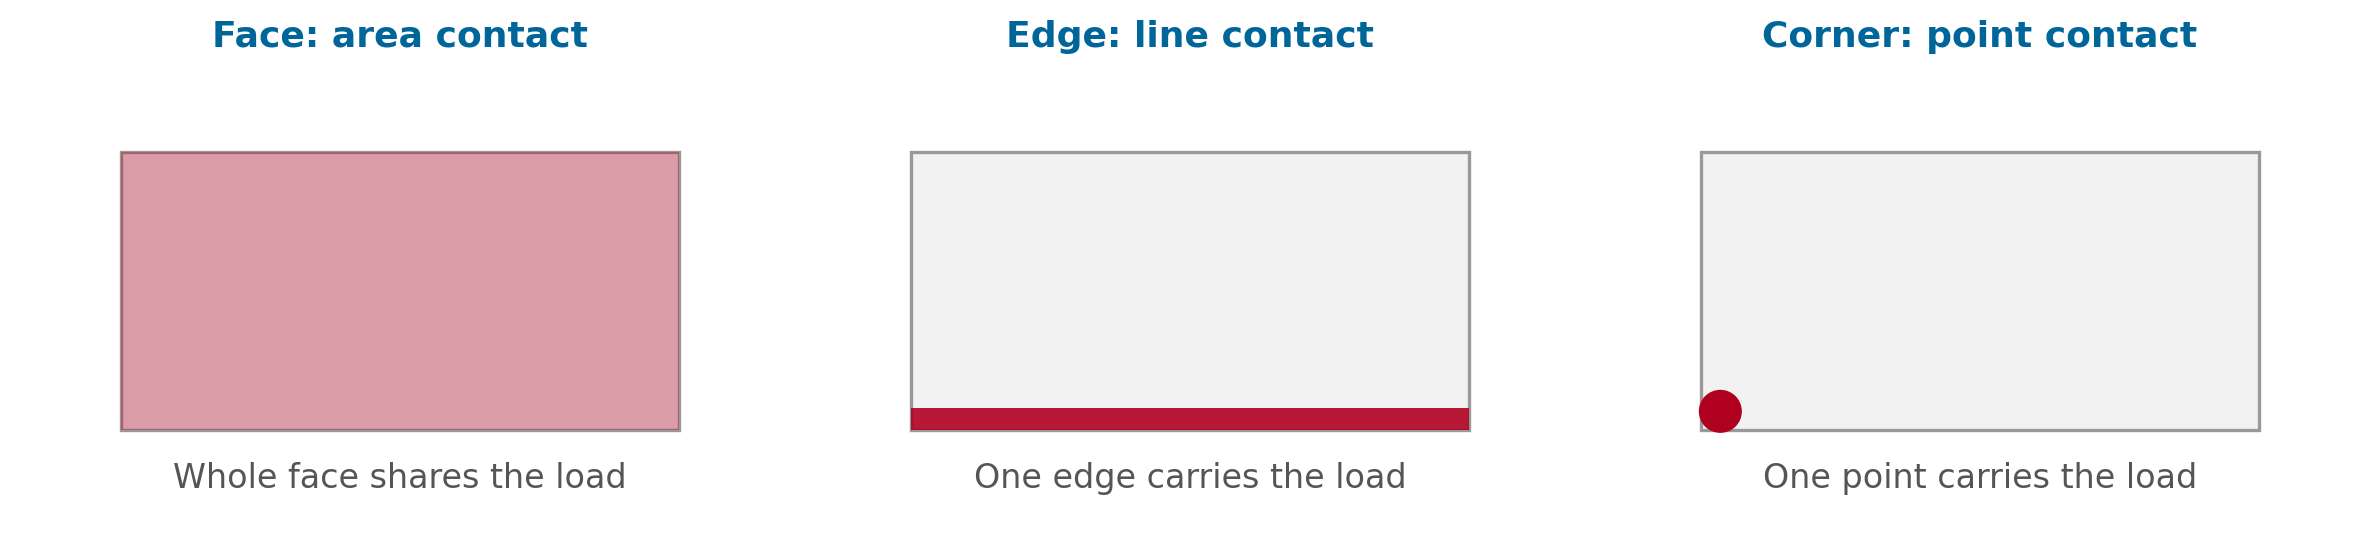
Figure 3. Face contact is an area, edge contact is a line, corner contact is a point.
A rectangular box has 6 faces, 12 edges, and 8 corners, 26 orientations in total, which is exactly the MIL-STD-810 transit drop sequence. The deck devotes a slide to each class.
Face. The stiffest contact. A large area on a hard surface gives the shortest pulse, about 0.3 to 1 ms, and the highest peak acceleration at the body center. This is the case that cracks BGA solder joints under the printed circuit board, which is why the JEDEC board-level drop test is a face-down event. A display-down landing loads the cover glass in bending across the frame. A face drop onto a pebble or paver edge converts the area contact into a point contact on the glass and produces a Hertzian ring or cone crack. Face landings have the highest coefficient of restitution, so the device bounces and may strike a second time. They are also the hardest orientation to achieve in free fall, since any tilt becomes an edge-first landing.
Edge. A line contact along the frame, and the most common real-world orientation, because the device rotates as it leaves the hand. Cover glass strength is set by edge flaws from cutting and finishing, and an edge landing puts tension right where that flaw population is worst. The frame deflects inward and closes the gap to the glass, and glass-to-frame contact at the rim is a frequent crack origin. Body G is lower than for a face drop, but local stress is far higher. Every edge landing is followed by rotation about the contact edge and a face slap, so an edge test is two impacts, not one.
Corner. A point contact, the smallest area and highest contact stress of the three. The frame corner dents plastically and absorbs a large share of the kinetic energy, so the pulse is longer, the body-center acceleration is the lowest of the three, and the coefficient of restitution is the lowest. Low body G does not mean benign. The corner of the cover glass sits at the stress concentration where two edges meet, and corner cracks radiate across the display. Corner drops are the dominant field failure for glass-fronted devices and are what drive case and bumper design.
| Attribute | Face | Edge | Corner |
|---|---|---|---|
| Contact geometry | Area | Line | Point |
| Contact stiffness | Highest | Intermediate | Lowest |
| Pulse duration | Shortest (0.3 to 1 ms) | Intermediate | Longest |
| Peak G at body center | Highest | Intermediate | Lowest |
| Local contact stress | Lowest | High along edge | Highest at a point |
| Energy absorbed locally | Little (elastic) | Moderate | Large (plastic dent) |
| Coefficient of restitution | High | Moderate | Low |
| Rotation after contact | Little | Rotates to a face | Rotates to an edge, then a face |
| Typical failure | PCB strain, solder joints, cone crack on glass | Glass edge crack, frame bending | Glass corner crack, frame dent, seal damage |
| Count in 26-drop sequence | 6 | 12 | 8 |
Table 3. Face, edge, and corner compared. Rankings are qualitative and assume a hard, flat landing surface.
The inversion. The orientation with the highest body G, the face, has the lowest local stress. The orientation with the lowest body G, the corner, has the highest. An accelerometer at the center of the device therefore ranks the three impacts in the opposite order from the damage they cause.
Rotation and Secondary Impacts
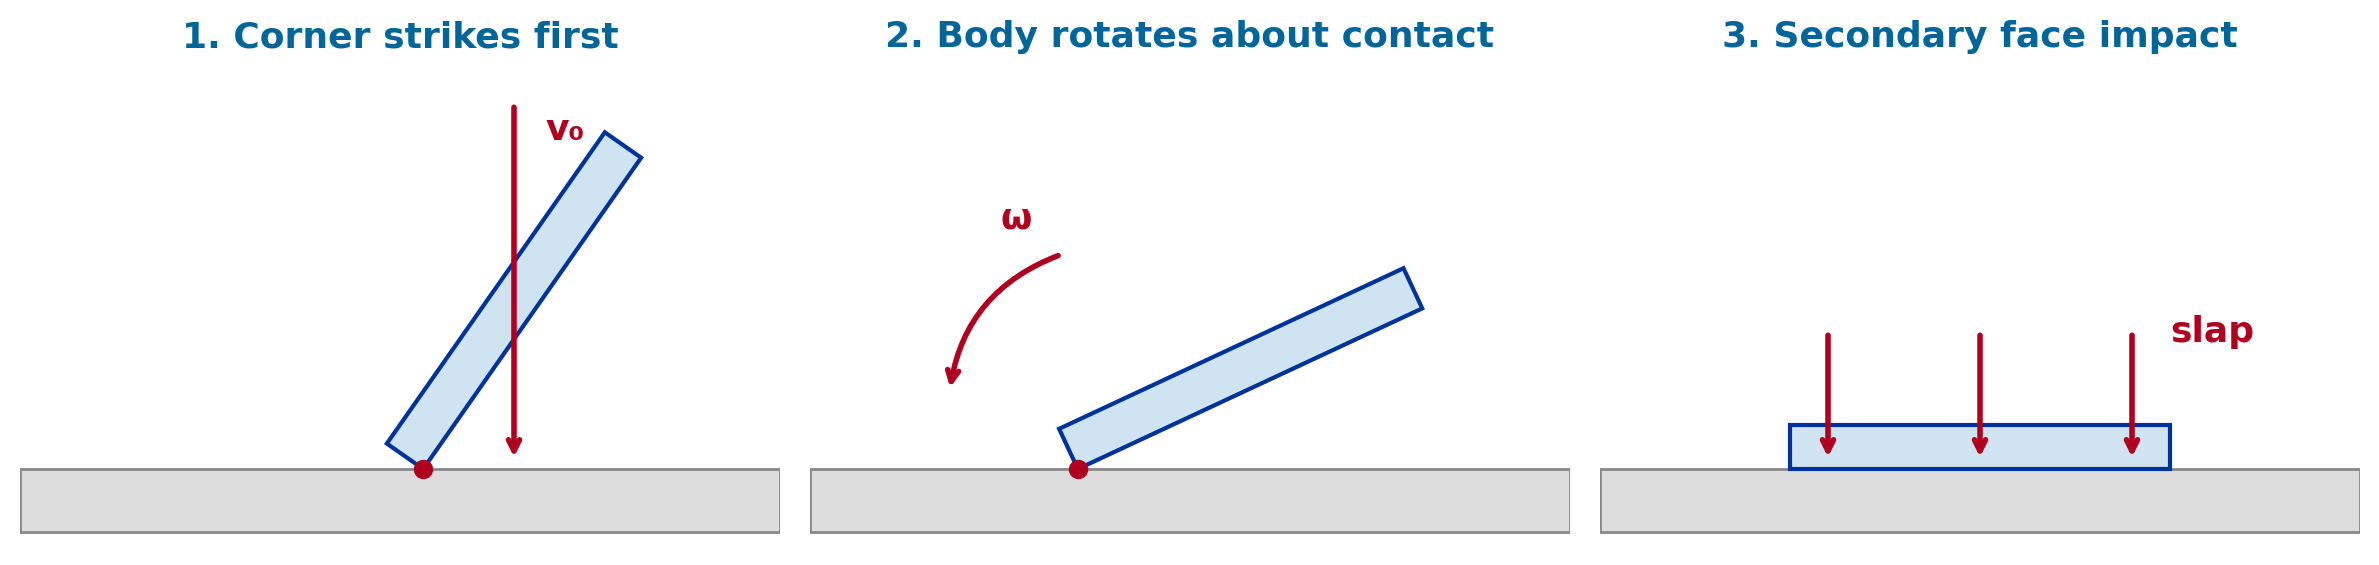
Figure 4. Almost every real drop is a sequence: the corner strikes, the body pivots on the contact, and a face slaps down.
Any off-center contact applies an impulsive moment about the mass center, so part of the kinetic energy becomes rotational energy. The device then strikes a second time on an edge or face, sometimes at a higher angular velocity than a straight fall onto that face would produce. Instrumented drops routinely show two or three distinct pulses within 20 to 50 ms, and the second pulse can exceed the first in peak G. Free-fall testers reproduce this behavior; guided drop towers suppress it. That is one reason the two methods do not produce the same damage. Report the full sequence, not just the first pulse, and record high-speed video of every drop.
Standards and Test Equipment
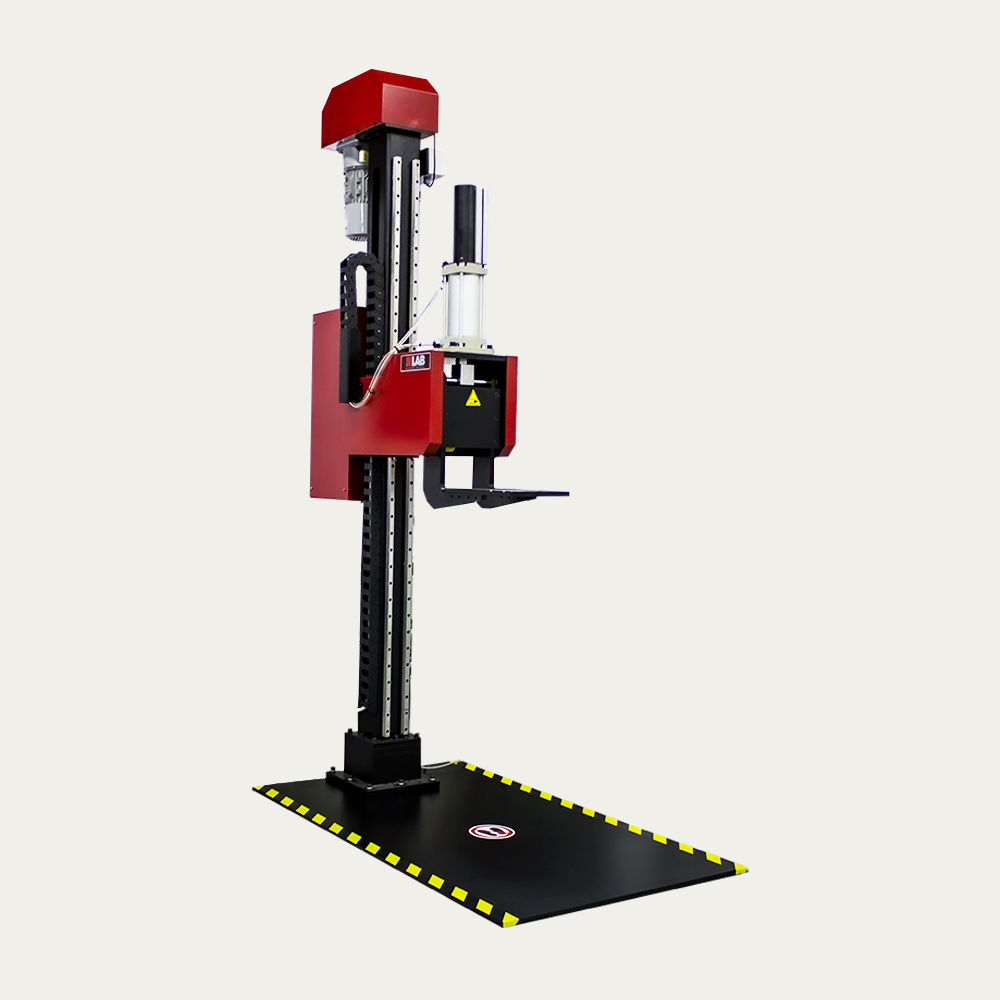
Figure 5. A drop shock test machine. Image: Techlab Systems.
The standards differ in what they protect. MIL-STD-810H Method 516.8 Procedure IV protects an item in its transit configuration with the 26-orientation sequence, 122 cm for man-portable items under 45 kg, onto 5 cm plywood over concrete, and the drops may be split among up to five samples. IEC 60068-2-31 Test Ec covers free fall, repeated free fall in a tumble drum, and topple, from 25 mm to 1000 mm onto concrete or steel. JEDEC JESD22-B111 is a board-level test of the solder joints: the PCB is mounted face-down on a guided drop table, subjected to a 1500 G, 0.5 ms half-sine, typically 30 drops, with daisy-chain resistance monitored. ASTM D5276 and the ISTA procedures cover the packaged product. Consumer OEM specifications are internal, but 30 to 50 drops from about 1 m onto concrete, steel, granite, or plywood is typical. Confirm counts, heights, and surfaces against the edition in force before writing a test plan.
Release method matters as much as height. A free-fall tester with pneumatic or vacuum release holds the device at the set attitude and reproduces rotation and secondary impacts. A guided drop tower on rails gives a repeatable attitude but no rotation. A tumble drum gives many random-orientation 0.5 m falls. A robotic arm allows programmed sweeps of attitude, height, and spin. The landing surface sets the contact stiffness, so the same device gives very different peak G on steel and on plywood, and surface roughness turns face contacts into point contacts on the glass.
Instrumentation is piezoresistive accelerometers with a ±20,000 G range sampled at 100 kHz or faster and low-pass filtered to remove ringing, strain gauges on the PCB near BGA sites, daisy-chain continuity monitored in situ, and high-speed video at 5,000 to 20,000 frames per second. Post-drop assessment includes functional test, cosmetic inspection, optical and X-ray inspection of solder joints, dye-and-pry on failed samples, and a shock response spectrum of each measured pulse so that orientations and surfaces can be compared on a common basis.
Analysis Methods and the Stress-Velocity Check
Analysis ranges from an energy balance with an assumed contact law, through Hertz contact for a corner on a flat, $F = \tfrac{4}{3} E^* \sqrt{R} \, \delta^{3/2}$, a hardening spring whose stiffness rises with penetration, to explicit finite element models in LS-DYNA or Abaqus/Explicit dropped at a sweep of attitudes with the glass, frame, adhesive, and PCB all present. For solder joints, PCB bending strain rather than peak G is the damage metric, with Steinberg-type fatigue on the strain amplitude.
The stress-velocity relation gives a useful sanity check. For a bar striking a rigid surface end-on, the stress at the impact face is
$$\sigma = \rho \, c \, v_0$$For aluminum with $\rho = 2700$ kg/m³ and $c = 5100$ m/s, a 1.0 m drop at 4.43 m/s gives $\sigma \approx 61$ MPa. For glass with $\rho = 2500$ kg/m³ and $c \approx 5400$ m/s, the result is about 60 MPa. The edge strength of unstrengthened glass is of this order, which is why chemically strengthened cover glass with a deep compressive surface layer is essential. Real structures see $\sigma = K \rho c v$ with $K$ from 1 to about 8 per Hunt and Gaberson.
Design Responses
The design responses map directly onto the three classes.
Corner: raised bumpers on the case so the corner never touches the ground, a ductile frame alloy that dents rather than cracks, a glass corner radius and inset from the frame corner, a compliant corner gasket, and a keep-out zone for components and solder joints at the PCB corners.
Edge: chemically strengthened glass with a deep compression layer covering the edge flaws, polished and chamfered glass edges to reduce the flaw population, a raised lip on the frame or case above the glass surface, a controlled glass-to-frame gap with an elastomer buffer, and frame stiffness tuned so the edge does not close the gap onto the glass rim.
Face: adhesive bonding of the glass to the frame so the two carry bending as a composite, underfill or corner staking for BGA components, PCB mounting points placed to reduce span and bending, internal foam or gel pads between battery and housing, and a slightly recessed display so a pebble contacts the lip rather than the glass.
Summary
The height sets the velocity, the contact sets the pulse, and the orientation sets where the stress goes. Face drops load the board. Edge drops load the glass rim. Corner drops dent the frame and crack the glass corner while reading the lowest G at the accelerometer. Rotation makes most drops a two- or three-impact sequence, which is why free-fall and guided methods differ. Test all 26 orientations, and judge severity by board strain and the SRS, not by the accelerometer peak alone.
The slides: Drop_Test_Face_Edge_Corner.pptx
See also my free ebook Shock and Vibration Response Spectra at Tom’s Ebooks.
References
MIL-STD-810H, Environmental Engineering Considerations and Laboratory Tests, Method 516.8 Shock, Procedure IV Transit Drop, 2019.
IEC 60068-2-31, Environmental Testing, Part 2-31: Tests, Test Ec: Rough Handling Shocks, Primarily for Equipment-Type Specimens, 2008.
JEDEC JESD22-B111A, Board Level Drop Test Method of Components for Handheld Electronic Products, 2016.
ASTM D5276, Standard Test Method for Drop Test of Loaded Containers by Free Fall.
F. V. Hunt, Stress and Strain Limits on the Attainable Velocity in Mechanical Vibration, Journal of the Acoustical Society of America, 32(9), 1960.
H. Gaberson and R. Chalmers, Modal Velocity as a Criterion of Shock Severity, Shock and Vibration Bulletin 40, 1969.
D. S. Steinberg, Vibration Analysis for Electronic Equipment, 3rd ed., Wiley, 2000.