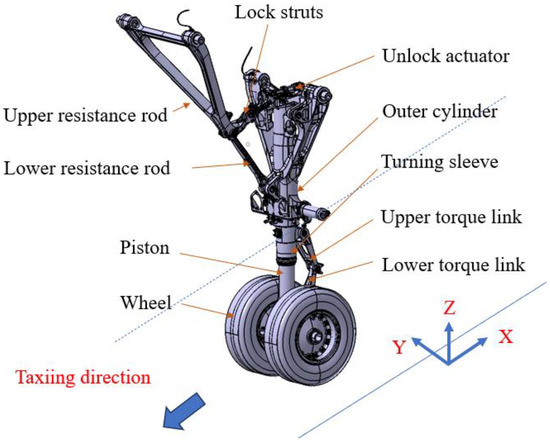
A landing gear is the only structure on the airplane that is designed to be hit. Everything else is sized to carry loads that arrive smoothly. The gear is sized to absorb a defined amount of kinetic energy in a fraction of a second, several times a day, for tens of thousands of cycles, while sitting in the one place on the airframe that collects water, de-icing fluid, runway salt, brake dust and tire rubber. Shock, vibration, fatigue and corrosion are usually taught as four separate subjects. On a landing gear they are four views of the same part.
This post walks the chain in the order the gear experiences it: the touchdown transient, the vibration environment of rolling, the fatigue spectrum that accumulates over a service life, and the corrosion that quietly decides what that service life actually is. A generic narrowbody main gear is carried through as a worked example so the numbers stay connected to each other. The model is a demonstration, not a certification analysis, but every number below comes out of it rather than out of a handbook. Five case histories at the end put each mechanism against an actual airplane.
One Load Path, Four Mechanisms
The vertical load path is short and entirely in series: runway, tire, shock strut, piston and axle, outer cylinder and its braces, then the airframe gear beam. There is no redundancy in it. Every mechanism discussed below attacks some part of that same chain, and they differ mainly in time scale. The touchdown transient lasts about a quarter of a second. Shimmy grows over a few tenths of a second and can destroy a nose gear in seconds. The fatigue spectrum accumulates over decades. Corrosion runs continuously, including while the airplane is parked and doing nothing at all.
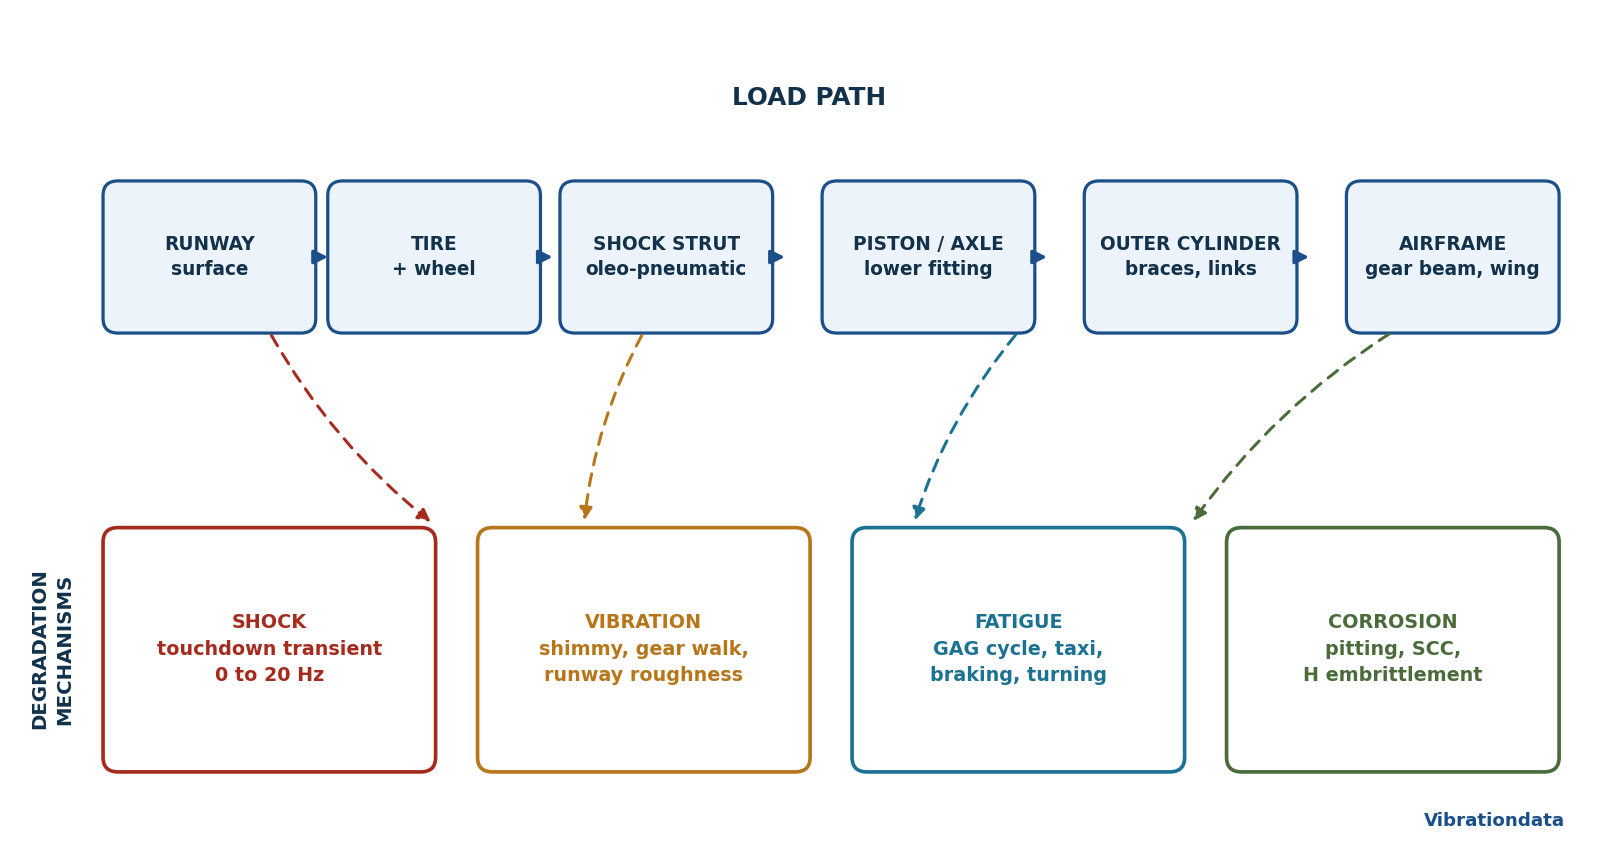
Figure 1. The vertical load path is a series chain with no redundancy. The four degradation mechanisms differ mainly in time scale.
The Worked Example
The demonstration airplane is a generic narrowbody at a design landing weight of 66,000 kg, with 47 percent of the weight on each main gear. That gives a sprung mass of 31,020 kg per main gear and a static ground reaction of 304 kN. The unsprung mass, meaning wheels, brakes, axle and the lower piston, is 550 kg. The strut is a single-stage oleo-pneumatic unit with a 190 mm bore, a 400 mm stroke, and a metered orifice. The parameters are listed below.
| Parameter | Symbol | Value |
|---|---|---|
| Sprung mass per main gear | $m_s$ | 31,020 kg |
| Unsprung mass | $m_u$ | 550 kg |
| Static ground reaction | $W_{st}$ | 304 kN |
| Pneumatic piston area | $A_p$ | 0.0284 m$^2$ (190 mm bore) |
| Full stroke | $S$ | 400 mm |
| Extended gas column, charge pressure | $L_g$, $P_0$ | 550 mm, 5.5 MPa |
| Metered orifice area, discharge coefficient | $A_o$, $C_d$ | 665 mm$^2$, 0.90 |
| Tire vertical stiffness, per gear | $k_t$ | 3.20 MN/m plus cubic hardening |
| Static strut pressure and stroke | 10.7 MPa (1,554 psi), 250 mm |
The strut force is the sum of a polytropic gas spring, a square-law orifice term, and bearing friction:
$$F_{air}=P_0A_p\left(\frac{L_g}{L_g-x}\right)^{\gamma},\qquad F_{damp}=\frac{\rho A_p^3}{2C_d^2A_o^2}\,\dot{x}\left|\dot{x}\right|$$
with $\gamma=1.35$ during the impact and $\gamma=1.1$ for slow servicing changes. The orifice coefficient works out to 27,800 N-s$^2$/m$^2$. Two natural frequencies fall out of the linearization about the static position: the airframe heaving on the gas spring at 1.14 Hz, and the wheel hop mode, the unsprung mass on the tire and strut in parallel, at 14.9 Hz. Those two frequencies show up again in every response plot in this post.
Touchdown: Where the Energy Goes
14 CFR 25.473 sets the design descent velocity at 10 ft/sec at the design landing weight and 6 ft/sec at the design takeoff weight, and it permits airplane lift up to airplane weight to be assumed during the impact. That lift assumption is the reason a landing is an energy problem rather than a force problem: with lift equal to weight, gravity is cancelled and the strut has to absorb the kinetic energy and nothing else. For this airplane at 10 ft/sec that is 144 kJ per main gear.
The classical energy balance sets that kinetic energy against the work done by the strut and the tire,
$$\tfrac{1}{2}m_sV^2=\eta_sF_{max}S+\eta_tF_{max}\delta$$
where $\eta_s$ is the strut efficiency, the ratio of the area under the force-stroke curve to the rectangle $F_{max}S$, and $\eta_t\approx0.47$ is the corresponding tire efficiency. A well-metered oleo runs $\eta_s\approx0.8$. A rubber block or a steel leaf spring runs closer to 0.5, which is why heavy airplanes do not use them. The efficiency is the whole design problem: for a fixed stroke, raising $\eta_s$ from 0.5 to 0.8 lowers the peak load by 37 percent.
Integrating the two-degree-of-freedom drop model at 10 ft/sec gives a peak vertical ground reaction of 500 kN, a gear reaction factor $N=F_{max}/W_{st}$ of 1.65, 312 mm of the 400 mm stroke consumed, 125 mm of tire deflection, and a strut efficiency of 0.77. The pulse is 250 ms long, with peak airframe acceleration of 1.62 G. At 12 ft/sec the same gear produces 673 kN, $N=2.21$, and 360 mm of stroke.
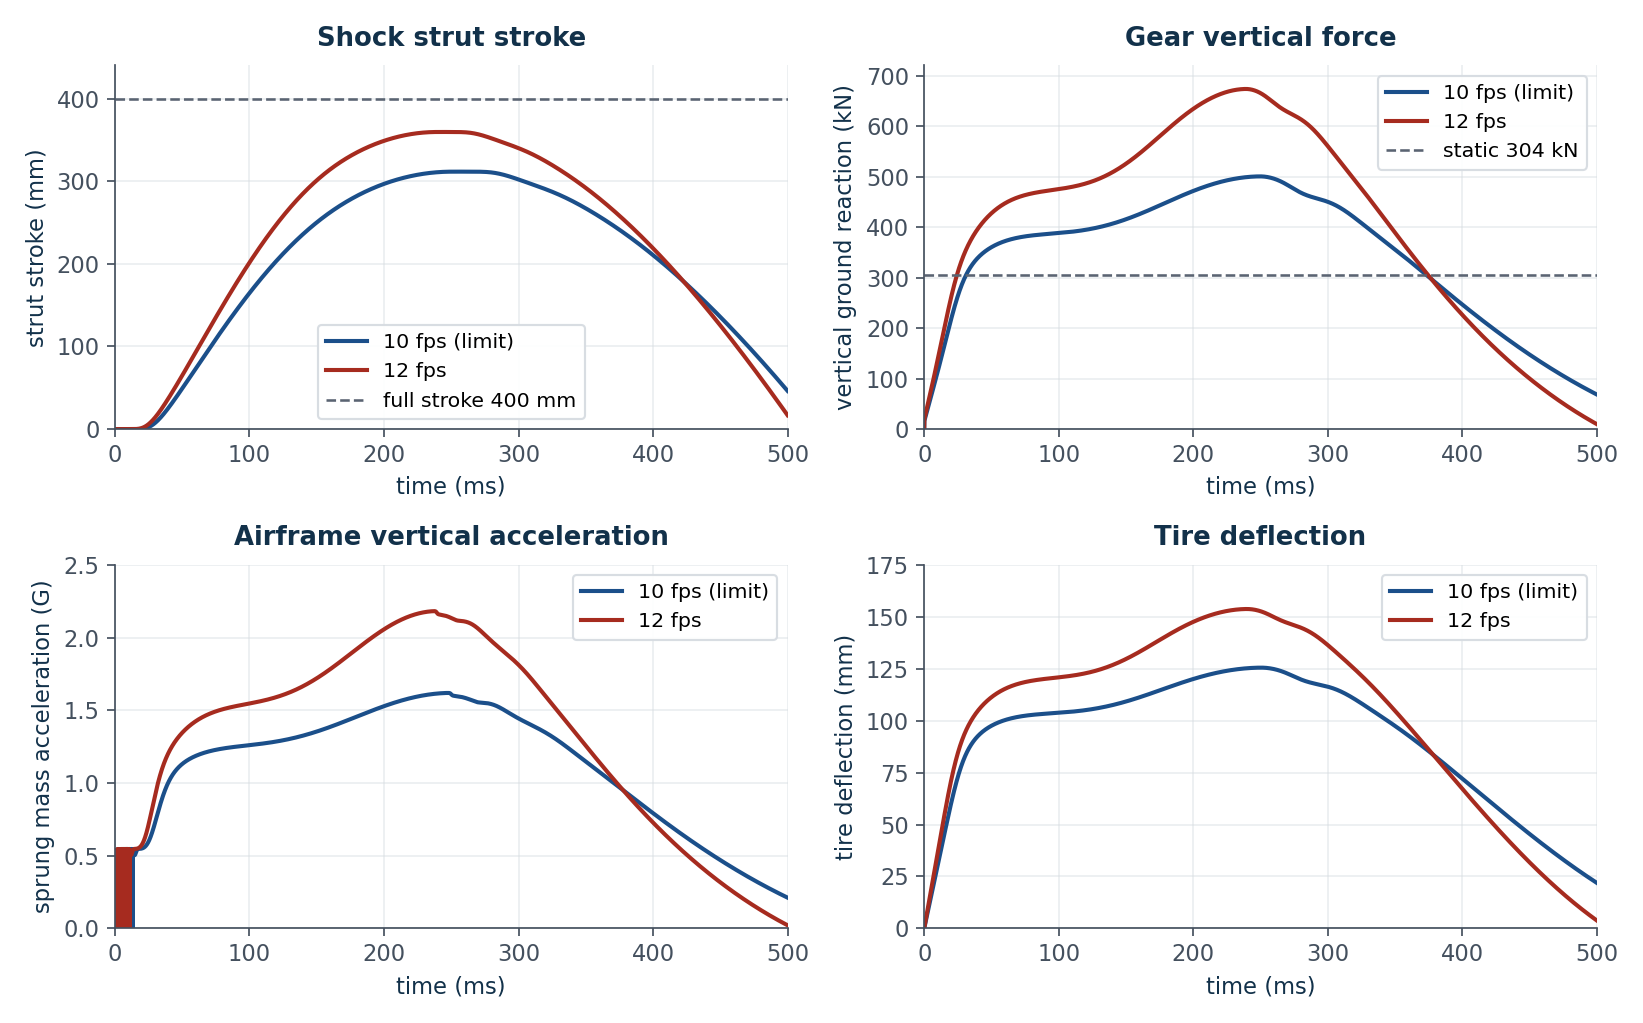
Figure 2. Touchdown time histories at the limit sink rate and at the reserve energy sink rate. The early shoulder at about 40 ms is the tire and unsprung mass; the broad peak near 250 ms is the airframe riding the strut down.
The shape of the force trace in Figure 2 is worth a second look. There are two distinct events in it. The first 40 ms belongs to the tire and the unsprung mass, which are stiff and light, and which build up 350 kN almost immediately. The broad peak near 250 ms belongs to the sprung mass, which is fifty times heavier and is riding down on the gas spring. A vertical accelerometer mounted on the axle sees the first event. One mounted in the avionics bay sees the second. They are not the same measurement, and confusing them is the source of a great deal of grief in hard landing assessment.
The Force-Stroke Diagram
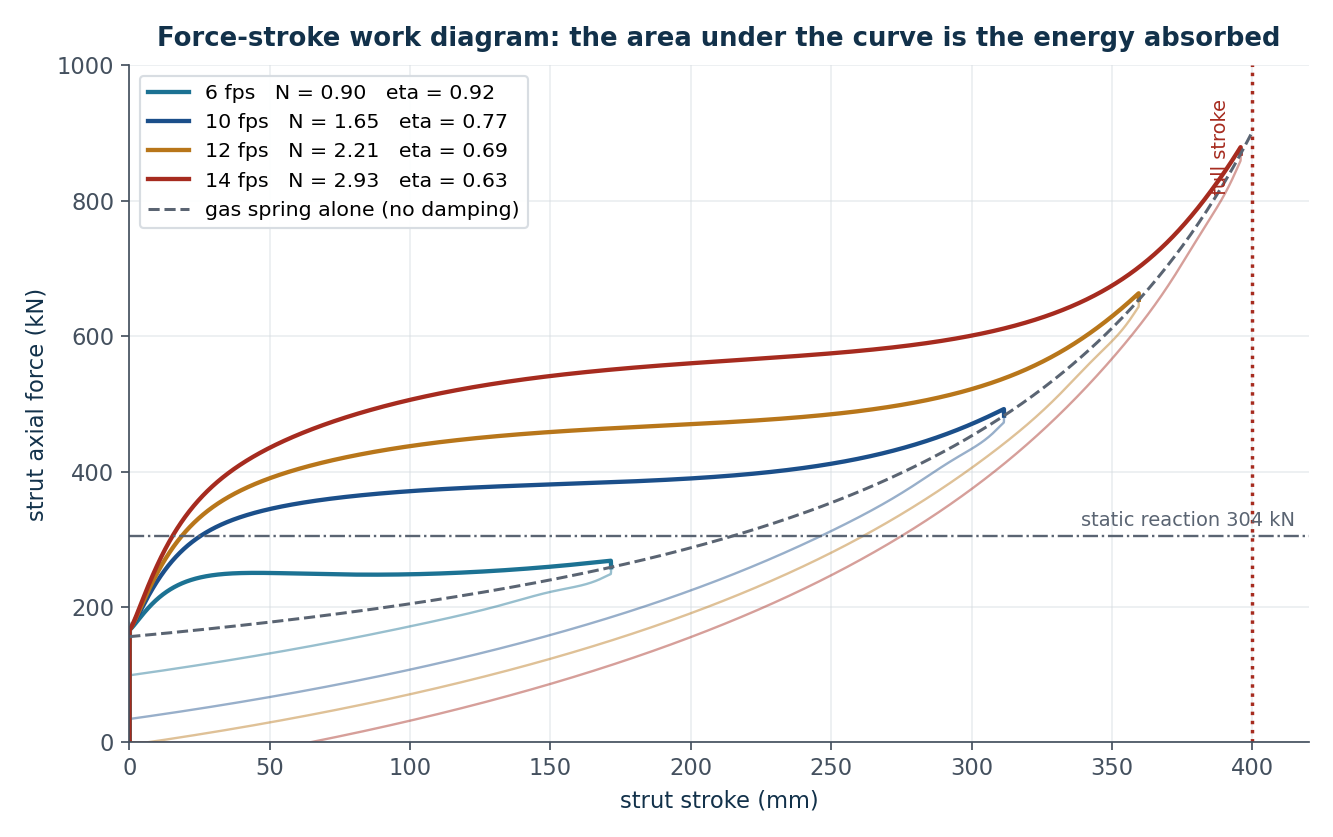
Figure 3. Force-stroke work diagrams. Heavy lines are compression, light lines the recoil. The dashed curve is the gas spring alone. The area between compression and recoil is the energy dissipated by the orifice.
Figure 3 is the single most useful diagram in landing gear work. The area under the compression curve is the energy absorbed. The area enclosed by the loop is the energy actually dissipated by the orifice, as opposed to stored in the gas and given back on recoil. A good strut is nearly rectangular, meaning the orifice raises the force quickly at the start of the stroke and then holds it flat, which is exactly what the metering pin inside a real strut is shaped to do. The dashed gas-only curve shows what a strut with no damping would deliver: a steeply rising exponential that wastes most of the stroke at low force and then spikes at the end. The gas spring is not the shock absorber. The orifice is.
Notice also how the curves stack. At 6 ft/sec the strut barely leaves the flat region. At 14 ft/sec it runs into the steep part of the gas curve near full stroke and the force climbs almost vertically. That steep tail is the difference between a hard landing and a broken airplane.
Why Sink Rate Is So Unforgiving
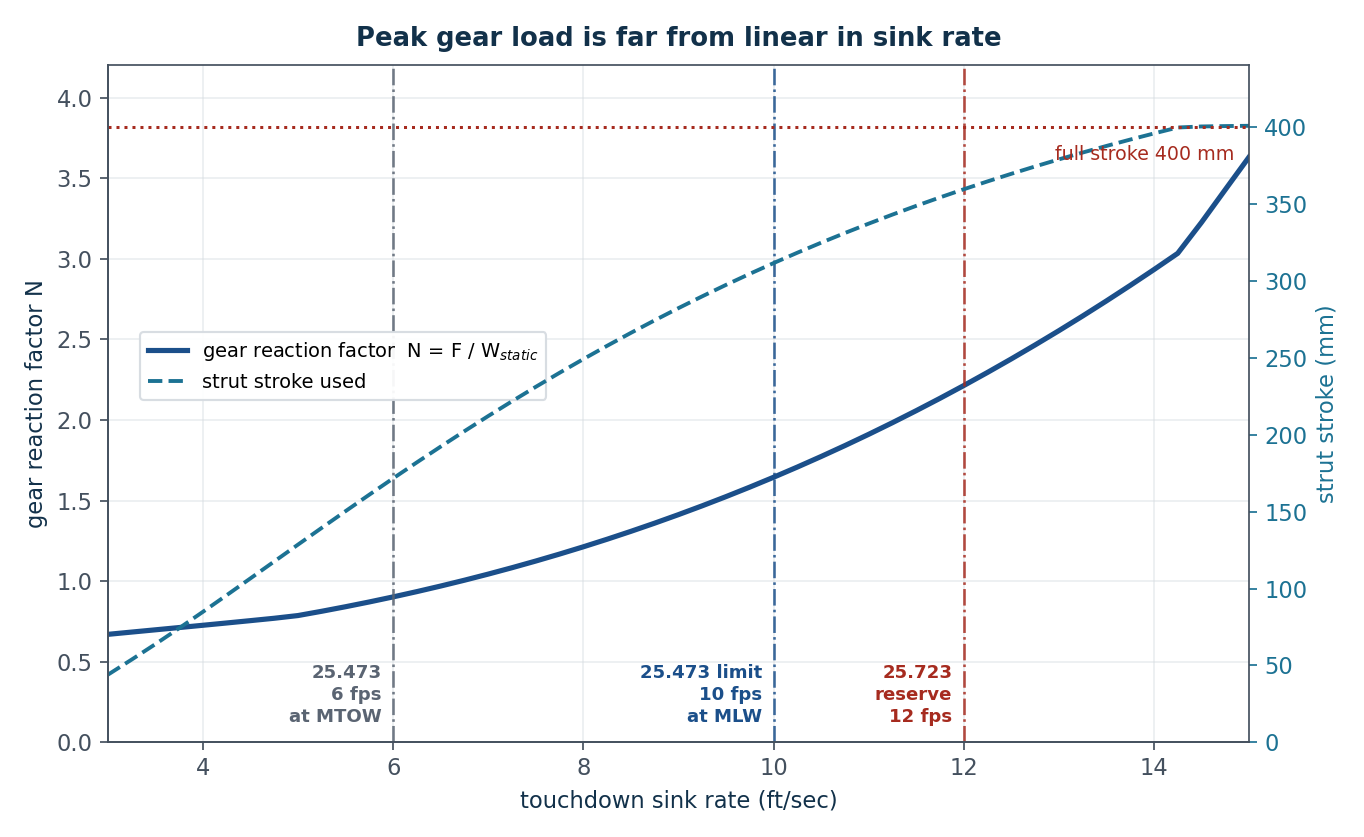
Figure 4. Peak gear load and stroke used versus sink rate. Beyond about 14 ft/sec the stroke curve flattens against the mechanical stop and the load curve turns upward.
Energy goes as $V^2$, so a 20 percent overspeed carries 44 percent more energy. If the strut absorbed that energy at constant force, the load would rise 44 percent. It does not, because the strut has a finite stroke, and as the stroke runs out the gas spring stiffens as $(L_g-x)^{-\gamma}$. Going from 10 to 12 ft/sec raises the peak load by 35 percent while the stroke used rises only 15 percent. Going from 12 to 14 ft/sec raises the load another 33 percent while the stroke rises just 10 percent, because there is almost nothing left to give. Past that, the strut bottoms on its mechanical stop and the load path stiffens by two orders of magnitude in a few millimetres.
This is also where the operational definitions come from. A common commercial threshold for a hard landing at maximum landing weight is 2.6 G at touchdown or a descent rate over 600 ft/min, and 600 ft/min is exactly 10 ft/sec, the 25.473 limit. The reserve energy requirement of 25.723 is separate and explicit: the gear may not fail in a test simulating a descent velocity of 12 ft/sec at design landing weight, which is the 12 ft/sec case above.
The Load Factor Trap
A Boeing patent on hard landing detection states plainly that “the load factor is an unreliable indicator of a hard landing event,” because the inertial reference unit sits far forward of the main gear and its reading is corrupted by pitch attitude, pitch rate and fuselage bending. On the 777-300 in particular, vertical acceleration alone would flag normal landings as hard. The patent triggers on computed sink rate instead, at 8 ft/sec normally and 6 ft/sec if the roll angle or roll rate is out of band. If you are building a hard landing monitor, this is the lesson: measure the thing the gear actually responds to, not the thing that happens to be instrumented.
The Touchdown Shock Response Spectrum
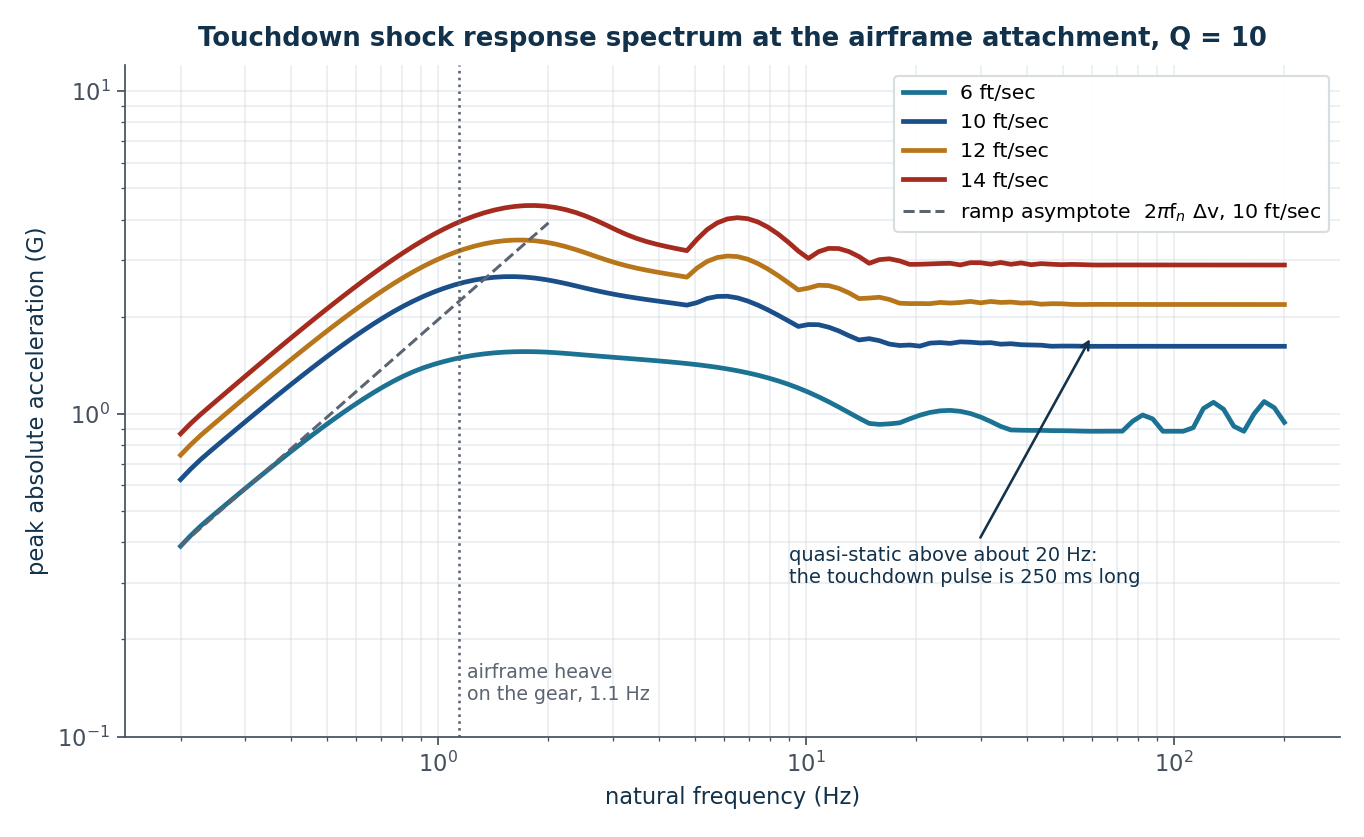
Figure 5. Shock response spectrum of the airframe attachment acceleration, Q=10. Below 1 Hz the spectrum follows the velocity-change asymptote. Above about 20 Hz it is flat at the peak acceleration.
The touchdown transient is a shock, so the natural way to characterize it for anything mounted on the airplane is a shock response spectrum. Figure 5 shows why the answer is less alarming than the word “shock” suggests. The pulse is 250 ms long. At low frequency the SRS follows the ramp asymptote $2\pi f_n\Delta v$, the classic velocity-change behaviour, and it peaks by a factor of about 1.6 near the 1.14 Hz airframe heave mode. Above roughly 20 Hz the spectrum is flat at the peak input acceleration, which is the definition of quasi-static: the equipment simply rides along.
So for a rack of avionics at 60 Hz, a 12 ft/sec landing is a 2.2 G quasi-static event, not a shock in any meaningful sense. The components that do care are the ones with low natural frequencies: fuel in tanks, overhead bins, seat tracks, engine pylons, and the gear itself. A useful sanity check is that the SRS at high frequency has to converge on the peak time history acceleration, and in Figure 5 it does.
One caution about this figure. The model is vertical only. A real touchdown also contains the wheel spin-up and spring-back drag transient, which is short, sharp, fore-and-aft, and reaches well above 20 Hz. Spin-up drag is the sizing case for the drag brace and the torque links on many gears even though it contributes almost nothing to the vertical load. If you are building an SRS for gear-mounted equipment, the vertical channel is not the interesting one.
Rolling: Roughness, Shimmy and Gear Walk
Once the airplane is on its wheels the gear stops being a shock absorber and becomes a suspension. Three vibration problems live here, and only one of them is forced.
Runway roughness is a random base input. Runway elevation follows a spatial power spectral density of roughly $\Phi(n)=\Phi_0(n/n_0)^{-2}$, and at ground speed $V$ the temporal PSD becomes $G(f)=\Phi_0n_0^2V/f^2$. The response, shown in the left panel of Figure 6, is dominated by the 14.9 Hz wheel hop mode at the axle and by the 1.14 Hz heave mode at the airframe. On smooth pavement the levels are modest, 0.08 GRMS at the axle in taxi and 0.18 GRMS during rollout at 70 m/s. On degraded pavement, an order of magnitude rougher, the axle sees about 0.5 GRMS with most of the energy between 5 and 30 Hz. That is the qualification environment for anything bolted to the gear: brake control units, tire pressure sensors, wiring, proximity switches.
There is a subtlety worth flagging. The orifice damping is quadratic in velocity, so at the millimetre amplitudes of taxi the effective damping is far lower than during a landing, and the bearing friction can be large enough relative to the load that the strut simply does not move at all. A stuck strut passes runway roughness straight into the airframe with only the tire in the path. This is a real service phenomenon and one reason strut servicing and seal condition affect ride quality far more than the numbers alone suggest.
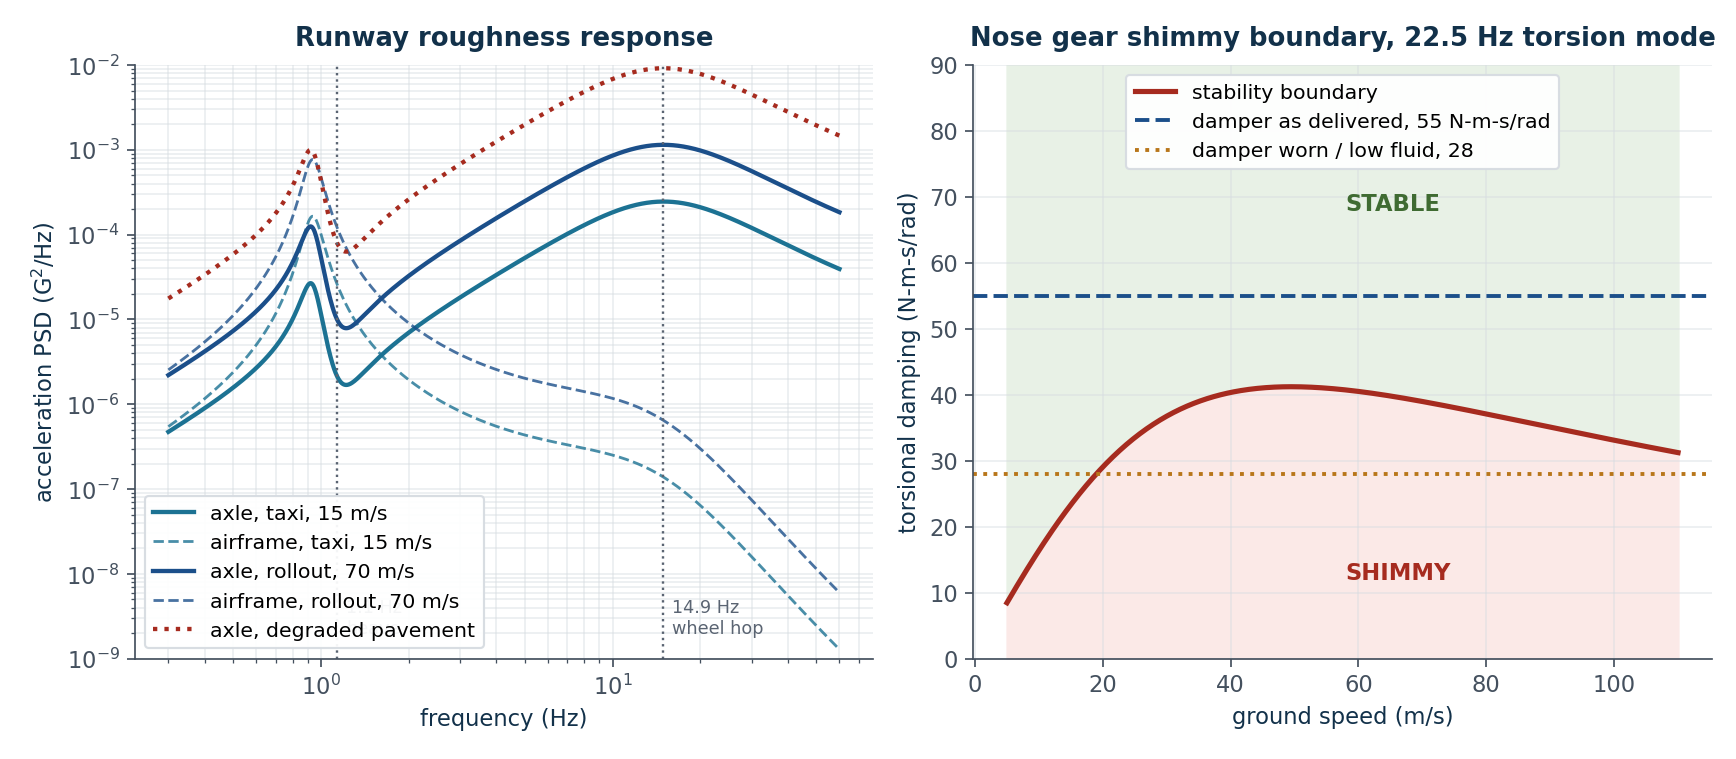
Figure 6. Left: acceleration PSD from runway roughness. Right: shimmy stability boundary for a nose gear with a 22.5 Hz torsion mode. Shimmy is a self-excited instability, so the question is never how much input there is.
Shimmy is different in kind. It is a self-excited torsional instability of the nose gear, driven by the phase lag between the wheel yaw angle and the tire side force. Model the torsion mode with inertia $I_\psi$ and stiffness $K_\psi$, and the tire with a stretched-string relaxation length $\sigma$ so that the lateral deflection obeys $\dot{y}+(V/\sigma)y=V\psi$, with side force $F_y=K_yy$ acting at mechanical trail $e$. Eliminating $y$ gives a cubic characteristic equation. With $\beta=V/\sigma$,
$$I_\psi s^3+(C+I_\psi\beta)s^2+(K_\psi+C\beta)s+(K_\psi\beta+eK_yV)=0$$
and the Routh-Hurwitz condition reduces to a clean requirement on the torsional damping,
$$C^2\beta+C\left(K_\psi+I_\psi\beta^2\right)>I_\psi V e K_y$$
The right panel of Figure 6 plots that boundary for $I_\psi=5$ kg-m$^2$, $K_\psi=1.0\times10^5$ N-m/rad (a 22.5 Hz torsion mode), $\sigma=0.35$ m, $C_{F\alpha}=1.2\times10^5$ N/rad and $e=0.10$ m. The required damping is not monotonic. It rises to a maximum of about 41 N-m-s/rad near 50 m/s and falls off at higher speed. A damper delivering 55 N-m-s/rad is comfortably stable everywhere. The same gear with a worn damper at 28 N-m-s/rad is unstable from roughly 19 m/s upward, which is right in the taxi and early takeoff roll band. Nothing about the excitation changed. Only the damping did.
That is the practical point about shimmy, and the reason shimmy damper servicing is not optional. Because the mechanism is self-excited, there is no input level below which it is safe. Worn torque link bushings, low damper fluid, tire imbalance or an out-of-round tire do not cause shimmy; they move the boundary, and then any disturbance at all will find it. The fifth case history below is that sentence written up as an incident report.
Gear walk is the third one: a fore-and-aft bending oscillation of the whole gear leg, typically 8 to 20 Hz, excited during braking. The antiskid system modulates brake pressure, the brake torque reacts through the gear leg, the leg deflects fore and aft, that deflection changes the wheel speed the antiskid controller is measuring, and the loop can close on itself. Gear walk is a control-structure interaction problem, not a purely structural one, and it is normally cured in the antiskid control law rather than in the metal. The brake control patents say so in their own background sections: US 6,142,585 describes the low-speed brake shudder that some airplanes exhibit, identifies it as gear structure moving fore and aft, names it as a dynamic instability between the gear structure and the brakes, and then fixes it by releasing brake pressure below a speed threshold rather than by changing anything structural. Gear walk matters here because the drag loads it produces are what the drag brace and torque links see, and those are fatigue-critical members that the vertical spectrum never touches.
The Fatigue Spectrum
Now accumulate. Take a critical fillet in the outer cylinder that runs 950 MPa at the 10 ft/sec limit landing, put the component S-N curve through 900 MPa at $10^3$ cycles and 400 MPa at $10^7$ cycles, giving a Basquin exponent of $m=11.4$, and apply a Goodman mean stress correction
$$\sigma_{ar}=\frac{\sigma_a}{1-\sigma_m/\sigma_u},\qquad N=N_1\left(\frac{\sigma_{a1}}{\sigma_{ar}}\right)^{m}$$
with $\sigma_u=1930$ MPa for 300M steel. Then build a flight and count the cycles: one ground-air-ground cycle, twenty minutes of taxi at both the 1.1 Hz and 14.9 Hz modes, eight braking cycles, four turning cycles.
| Segment | Cycles per flight | $\sigma_a$ (MPa) | Damage per flight |
|---|---|---|---|
| GAG cycle, landing impact | 1 | 475 | 1.74e-05 |
| Turning, side load | 4 | 200 | 5.3e-10 |
| Taxi, wheel hop 14.9 Hz | 18,000 | 45 | 1.7e-12 |
| Braking, gear walk | 8 | 120 | 9.2e-13 |
| Taxi, airframe heave 1.1 Hz | 1,320 | 20 | 1.2e-17 |
| Total | 1.74e-05, or 57,400 flights |
The ground-air-ground cycle does 99.997 percent of the damage at this location. Everything else is noise. That result is not an artifact of the numbers chosen; it is a direct consequence of the exponent. With $m=11.4$, halving the stress amplitude divides the damage by 2,600. The taxi cycles are numerous but small, and small loses badly to an exponent of 11.
Three important qualifications. First, this holds at the highest stressed vertical-load location. The drag brace, the torque links, the steering collar, the downlock linkage, the wheels and the brakes see completely different spectra in which ground manoeuvres, braking, turning and retraction are dominant and the GAG cycle is not.
Second, the table contains no ground handling at all, and neither does any spectrum derived from flight data. Towing and pushback put loads into the nose gear from a tug rather than from the airplane, at whatever attitude, turn angle and towbar condition the ramp allows, and they can be severe: the NTSB investigated an overload failure of a 737 nose gear during towing that also addressed six previous reports of 737 nose gear collapse during pushback or towing in the preceding two years, together with towbar design. Jacking is the same kind of load from the same kind of source. None of those cycles appear in a flight data recorder.
Third, the airplane-level design life for a gear of this class is on the order of 48,000 to 60,000 landings, and 57,400 lands in that range, which is a reassurance that the demonstration is not wildly off. A real analysis uses component-test S-N data with scatter factors, and the fatigue loads come from measured spectra rather than assumed ones.
What One Hard Landing Costs
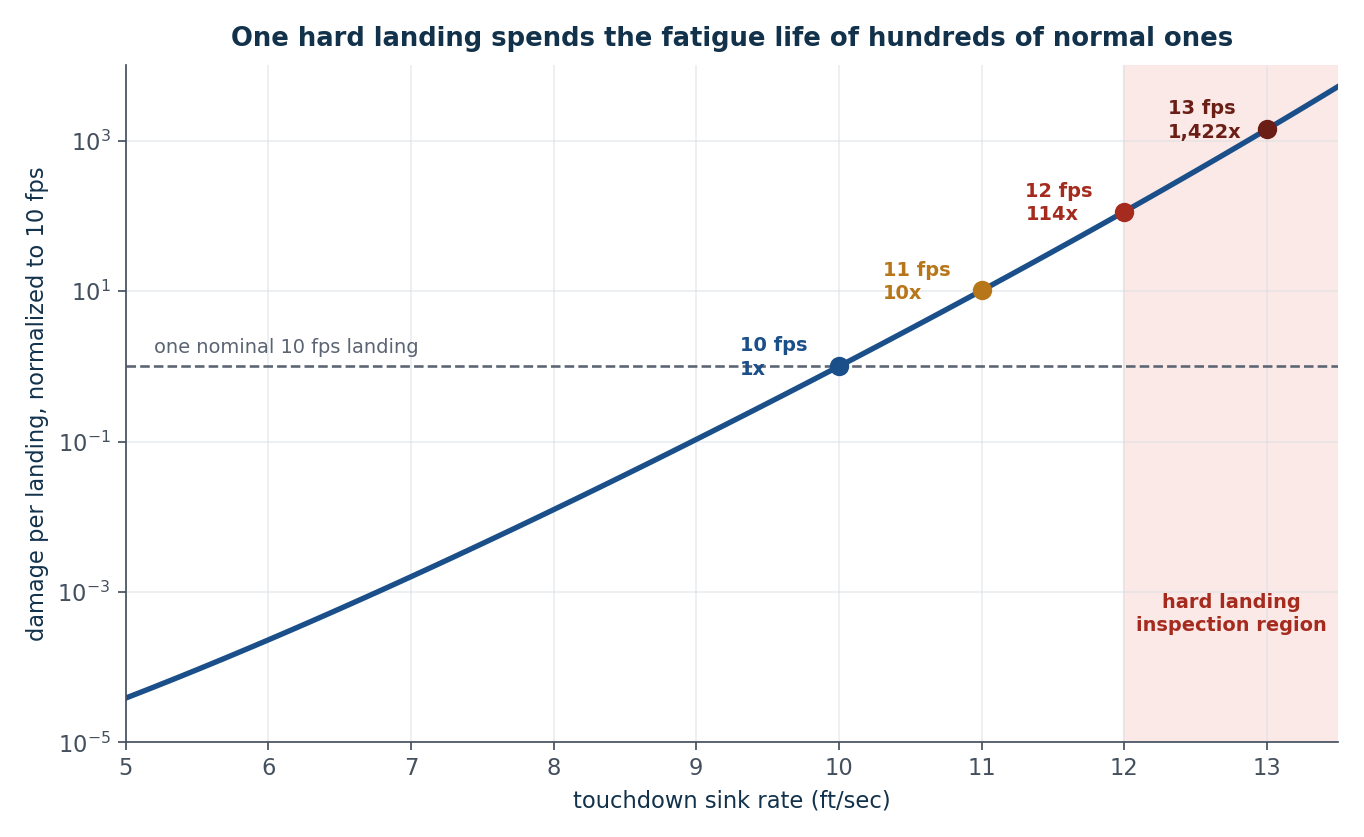
Figure 7. Damage per landing, normalized to a nominal 10 ft/sec touchdown. The vertical scale is logarithmic and spans nine decades.
Combine the nonlinear load versus sink rate curve of Figure 4 with the eleventh-power S-N exponent and the result is Figure 7, which is the number most worth carrying away from this post.
| Sink rate | Peak load | $N$ | Stroke used | Peak stress | Equivalent normal landings |
|---|---|---|---|---|---|
| 6 ft/sec | 275 kN | 0.90 | 172 mm | 521 MPa | 0.0002 |
| 8 ft/sec | 369 kN | 1.21 | 249 mm | 701 MPa | 0.012 |
| 10 ft/sec (limit) | 500 kN | 1.65 | 312 mm | 950 MPa | 1 |
| 11 ft/sec | 581 kN | 1.91 | 337 mm | 1,104 MPa | 10 |
| 12 ft/sec (reserve) | 673 kN | 2.21 | 360 mm | 1,279 MPa | 114 |
| 13 ft/sec | 777 kN | 2.55 | 379 mm | 1,475 MPa | 1,420 |
| 14 ft/sec | 892 kN | 2.93 | 396 mm | 1,694 MPa | exceeds yield |
A single 12 ft/sec touchdown consumes as much fatigue life at this location as 114 normal landings. A 13 ft/sec touchdown consumes 1,420. At 14 ft/sec the peak stress reaches the 1,690 MPa yield strength of 300M and the analysis leaves the elastic S-N regime entirely; that component is a removal, not an inspection.
Two honest caveats sit alongside this. Miner’s rule is linear and takes no account of sequence, and a large overload leaves a compressive plastic zone at the notch root that retards subsequent crack growth. So a hard landing is worse than linear damage summation suggests for crack initiation, and can be better than it suggests for the propagation of a crack that already exists. Any crack growth analysis that ignores retardation on a spectrum with occasional large overloads will be conservative, sometimes by a factor of several.
Corrosion Decides the Real Life
Everything above assumed clean metal. It is not a good assumption. Landing gear are made from ultra-high-strength low-alloy steels, typically 300M or 4340M at 1,930 MPa ultimate and 55 HRC, because nothing else gets that much strength into that little envelope. The price is that these alloys have low fracture toughness, are highly notch sensitive, and are strongly susceptible to both stress corrosion cracking and hydrogen embrittlement. The protection scheme, historically cadmium plating over a shot-peened surface, is the only thing standing between the steel and a wheel well full of salt water.
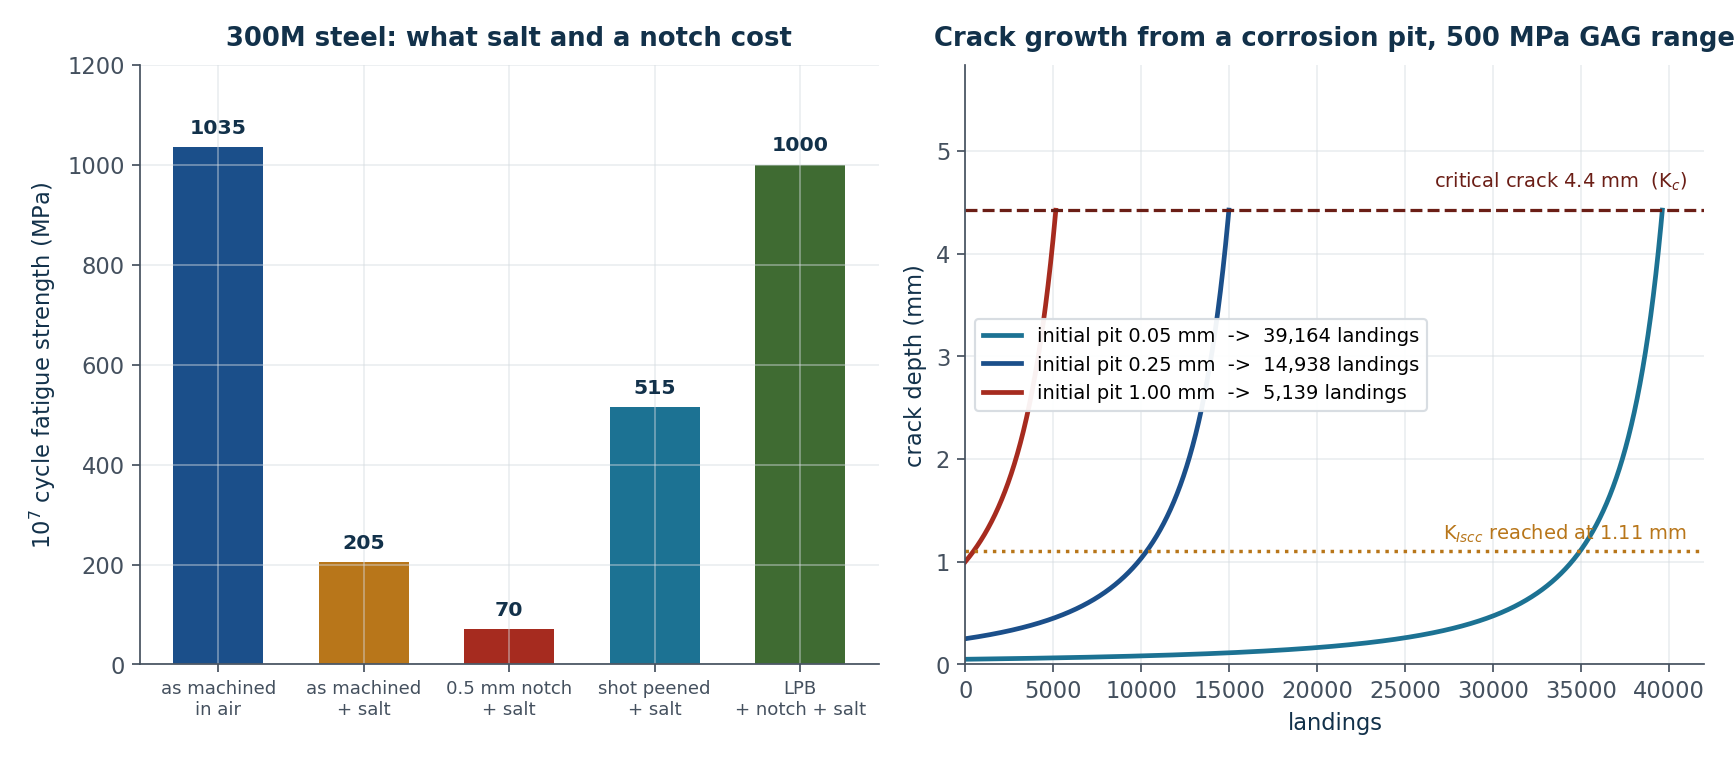
Figure 8. Left: measured 300M fatigue strength in air and in salt, after Lambda Technologies test data. Right: computed crack growth from corrosion pits of three depths at a 500 MPa GAG stress range.
The left panel of Figure 8 is the part that should be uncomfortable. Test data on 300M gives about 1,035 MPa fatigue strength at $10^7$ cycles as machined in air. Add salt exposure and it falls to about 205 MPa, a factor of five. Add a 0.5 mm notch on top of the salt and it falls below 70 MPa, a factor of fifteen from the clean value. That is the entire margin of the design, gone, from a corrosion feature that would be invisible without magnification. Shot peening recovers a great deal of it, roughly 515 MPa in salt, by holding a compressive residual stress of about $-1,033$ MPa at the surface. Low plasticity burnishing, which puts a similar magnitude of compression an order of magnitude deeper, restored roughly 1,000 MPa in the notched and salted condition in the same test program, and produced no SCC failures at 1,500 hours where untreated specimens failed in 13 to 262 hours depending on stress.
The right panel takes a lower stressed location, an outer cylinder bore at a 500 MPa GAG stress range, and grows a crack from a corrosion pit with the Paris law,
$$\frac{da}{dN}=C(\Delta K)^n,\qquad \Delta K=1.12\,\Delta\sigma\sqrt{\pi a}$$
using $C=6.6\times10^{-12}$ and $n=3$ in units of m/cycle and MPa$\sqrt{\mathrm{m}}$. With a fracture toughness of 66 MPa$\sqrt{\mathrm{m}}$ the critical crack depth is only 4.4 mm. A 0.05 mm pit reaches it in 39,000 landings. A 0.25 mm pit, which is a perfectly ordinary pit under a coating breach, reaches it in 14,900. A 1 mm pit reaches it in 5,100. Against a design life near 57,000 landings, a quarter-millimetre pit removes three quarters of the life of the part.
And there is a worse threshold on that plot. Landing gear steels have $K_{Iscc}$ in the range of 25 to 35 ksi$\sqrt{\mathrm{in}}$, roughly half of $K_{Ic}$. At this stress level that corresponds to a crack depth of about 1.11 mm. Above it, sustained load in a chloride environment can drive the crack with no fatigue cycling at all, which means the airplane can be parked on a wet ramp over a weekend and the crack still grows. Cyclic life calculations do not see that mechanism, and neither do cycle counters. There is more on the mechanisms and on $K_{Iscc}$ values in the earlier Stress Corrosion Cracking post.
Hydrogen embrittlement runs on the same materials from the opposite direction. Cadmium electroplating charges hydrogen into the steel, which is why the process specifications call for a bake within a few hours of plating and why grinding, pickling and improper repair plating of high-strength steel parts have caused delayed failures for decades. At 55 HRC, 300M is squarely in the susceptible range.
Grinding deserves its own paragraph, because it is the one item on this list that is introduced by the shop that is supposed to be restoring the part. Grinding after plating is a normal step, and abusive grinding raises the local surface temperature enough to re-austenitize and re-quench a thin skin, leaving untempered martensite and tensile residual stress in exactly the layer that shot peening was there to hold in compression. A published failure analysis of cargo aircraft main landing gear truck beams found longitudinal cracking at the rear axle bore of both beams from the same overhaul, in 4340 at 50 to 55 HRC, with the back side arm breaking after 160 landings from overhaul, and traced it to abusive grinding during the overhaul process acting through an embrittlement mechanism in both the initiation and propagation stages. One hundred and sixty landings, against the 57,400 computed above. The NTSB has examined trunnion pin fatigue fractures with the same signature in 4340M, chrome plated and ground to dimension, where the crack origins coincided with grinding damage, and where the damage was characterized by Barkhausen noise inspection and by nital temper etch after the coating was stripped. Note what that implies for a receiving inspection: the damage is a real, measurable property of the surface, and whether you find it depends entirely on whether the method you chose is sensitive to residual stress and microstructure rather than to open cracks.
One more point before the case histories. The pit in the analysis above is a stress concentration that happened to be produced by corrosion. Nothing in the Paris integration cares how the notch got there. A tool mark left by a file or a grinder at a forging parting line does the same job, is the same size, and is present from the day the part is made rather than arriving after a decade of service. The Delta 717 case below is exactly that.
Five Case Histories
1. FedEx MD-10-10, Fort Lauderdale, 28 October 2016.
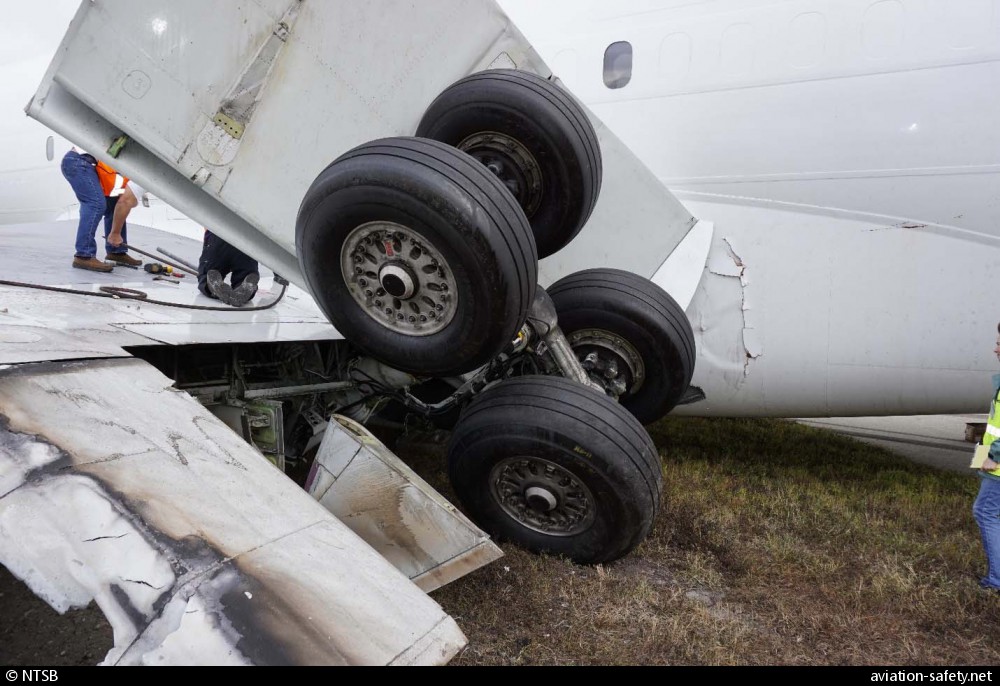
2. Scandinavian Airlines Bombardier Q400, Aalborg, Palanga and Copenhagen, September and October 2007. Three right main landing gear collapses on one operator’s fleet in seven weeks. Danish investigators identified corrosion of the internal threads of the right main gear retract actuator piston, which let the rod end separate from the piston; the gear then extended without the actuator restraining it, and the investigation found that this separation contributed to the collapse on touchdown. The airplane at Aalborg left the runway, struck propeller debris into the cabin and injured several occupants.
Two things make this one worth putting directly next to FedEx. The first is the interval. Bombardier issued an all-operators message five days after the first event recommending landing gear inspection for airplanes above 8,000 flights, against a previous requirement to check that component after 15,000 landings. The second is what the fleet inspection then found: corrosion inside the actuator on 25 of the 27 airplanes examined. The corrosion was not an outlier condition on one unlucky airframe. It was the fleet’s normal condition, and the interval had been set on the assumption that it would not be. The operator eventually withdrew the type permanently.
Note also where the failed part sits. A retract actuator is not in the vertical load path, is not sized by the touchdown transient, and sees roughly two significant load cycles per flight. It is the same class of member as the Delta 717 upper lock link below, and the GAG-dominated spectrum of the fatigue section says nothing whatsoever about either of them.
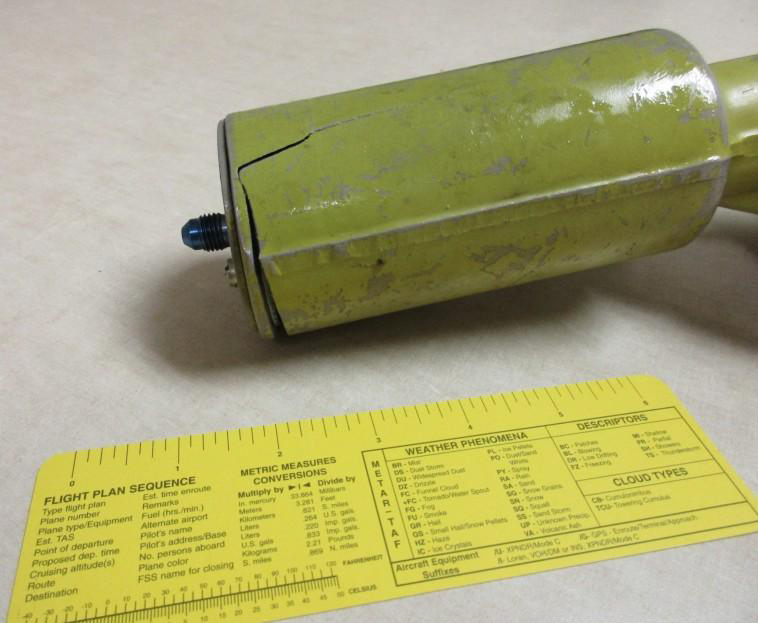
3. Cessna 210 landing gear actuator, NTSB report AIR-25-06.
4. Delta Air Lines Boeing 717-200, Charlotte, 28 June 2023.
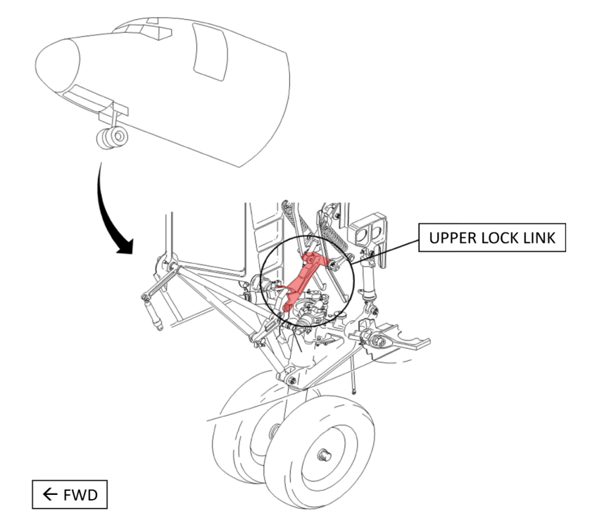
The fracture surface carried the entire history. The NTSB found a thumbnail fatigue region about 1.07 in wide by 0.42 in deep growing from the lower surface at the forging parting line, initiating at horizontal and vertical scratch features consistent with filing or grinding, and terminating in tensile overstress. Surface roughness on the lower surface away from the parting line measured 59 to 66 microinches RMS. On the parting line where the crack started it measured 185 to 508 microinches RMS, against a requirement of 125. Striation counting on the fatigue region gave an estimated 39,059 cycles to failure, against 41,257 flight cycles accumulated by the link. The crack therefore initiated within roughly the first two thousand cycles, about five percent of the life, and spent the other ninety-five percent growing. The Board concluded that the cracking began early in the part’s life and that the scratches were present in the as-manufactured condition.
That is not the FedEx story. Nothing corroded through a coating, and no overhaul interval had been stretched. Some pitting was seen near the origin, but the Board could not separate it from post-accident exposure and chemical paint stripping, and at most it added to a stress concentration the scratches had already created. What makes this case worth putting beside the others is that the inspection existed and was aimed squarely at this failure. Service Bulletin 717-32-002, issued in December 2001 after an earlier upper lock link fracture, called for eddy current inspection of the nose landing gear upper lock link assembly and for verifying that the surface finish was 125 RMS and free of transverse machining marks, modifying the part as required. This link went through that bulletin at Israel Aerospace Industries in 2009, at 17,313 cycles, and was marked as complied with. The scratches were still there when the fracture was examined in 2023, some 24,000 cycles later. The probable cause names both halves: fatigue fracture initiating along the scratch features at the parting line, with the overhaul facility’s noncompliance with the service bulletin contributing.
5. Continental Airlines Boeing 737-300, Newark, 6 November 1998. The four cases above are all crack cases. This one contains no crack at all, and it is the only case history here that belongs to the stability boundary of Figure 6 rather than to the Paris law of Figure 8.
Flight 1924 landed at Newark with a twisted right main landing gear; the wheels had rotated about 45 degrees outboard. The lower torsion link had failed, and metallurgical examination found overstress, with no fatigue. The apex nut joining the upper and lower torsion links was loose on the shimmy damper shaft, and the shaft itself was bent about 20 degrees rearward. A Boeing service letter had already documented the sequence, having seen it before: excessive play at the torsion link apex joint renders the shimmy dampers ineffective. The probable cause was the loss of torque on the apex nut, for undetermined reasons, leading to failure of the torsion link.
Read that against the right panel of Figure 6. The runway did not change. The speed did not change. No crack had to exist first, and no inspection interval had been stretched. Freeplay at one joint and a damper no longer coupled the way it was designed to be coupled moved the required-damping curve until the operating point fell on the wrong side of it, and after that the failure was a matter of seconds. A milder version of the same physics shows up in a Cirrus SR22T nose gear separation at Paso Robles in November 2015, where the strut tube cracked in fatigue from sideways bending at the toes of a gusset weld and subsequent testing showed that shimmy events, or nonstandard towing, could produce those cracks — shimmy acting as a fatigue load source rather than as an immediate overload, and the manufacturer responding with an inspection bulletin, a towing advisory and a design change.
The first four cases share a structure worth naming. The load spectrum was nominal. The material was as specified. The design was adequate. In the first three, what failed was the assumption that the surface would stay protected, and the inspection interval that had been chosen on the strength of that assumption. The fourth is a harder version of the same thing. The notch was not an assumption about the future; it was there from the forge. An inspection written specifically to find it was performed, recorded, and stamped, and the notch survived it by another two decades of service. A signed-off inspection is evidence about the paperwork. The fracture surface is evidence about the part.
The fifth belongs in the list precisely because it does not share that structure. There was no pit, no notch, no crack, and no inspection to miss. There was a nut that had lost its torque and a joint that had gained a little play, and that was sufficient. No fracture surface can be read for a cause of that kind, because the cause is not in the metal. The only observable that would have given warning is a modal property — the gear torsion frequency and the damping available in the torque link and damper path — and that is not a quantity anyone measures on a line check.
What This Means for Measurement
Practical Takeaways
Measure sink rate, not cabin vertical acceleration. The accelerometer is usually far from the gear and is corrupted by pitch rate and fuselage bending, and the manufacturers who have looked hardest at this have said so in print.
Record strut pressure and stroke, not only peak load factor. Pressure and stroke give the force-stroke work diagram directly, which is the true measure of what the strut did and the fastest way to detect a strut that is under-serviced, sticking, or leaking nitrogen.
Instrument the drag axis. Spin-up and spring-back and gear walk are fore-and-aft, they carry the higher-frequency content, and they size members that the vertical channel says nothing about.
Treat a modal shift on a gear as a boundary-condition question first. Torque link wear, bushing play, damper fluid level and strut servicing all move gear torsion frequency and shimmy margin, and they move it without any crack existing. The fifth case history is what that looks like when nobody is watching the boundary.
Set overhaul intervals from crack growth life with the pit assumed present, not from the fatigue initiation life of clean metal. The difference in the example above is a factor of four, and it is the factor that has actually put airplanes off runways.
Do not confuse a completed service bulletin with a completed inspection. Surface finish is a measurable quantity with a number on the drawing, and it is worth verifying with an instrument rather than a signature, because a 508 microinch parting line against a 125 microinch requirement is a notch that will start a crack in the first two thousand cycles and then stay invisible for the next forty thousand.
Choose the NDT method for the damage you expect, not for the damage that is easy to find. Open cracks answer to penetrant and magnetic particle. Grinding burn and residual stress do not; they answer to Barkhausen noise and temper etch, and a part can pass the first pair while carrying the second.
The final observation is a general one. Four disciplines look at a landing gear and see four different problems: the loads engineer sees an energy absorber, the dynamicist sees a lightly damped structure with two low modes and a self-excited instability, the fatigue engineer sees a spectrum dominated by a single cycle per flight, and the materials engineer sees ultra-high-strength steel with a coating on it. All four are correct and none is sufficient. The failures happen at the seams: an inspection interval set from a fatigue calculation that assumed no pit, a hard landing threshold set from an instrument that does not measure what the gear responds to, a surface finish requirement treated as a cosmetic note, a shimmy damper whose service condition was treated as a comfort item. The gear does not distinguish between the four subjects, and neither should the analysis.
References
1. 14 CFR 25.473, Landing load conditions and assumptions, eCFR.
2. Hard Landing, SKYbrary Aviation Safety.
3. Hard Landing Report Based on Sink Rate Algorithm, US 2011/0276217 A1, The Boeing Company.
4. Antiskid/Autobrake Control System with Low-Speed Brake Release to Reduce Gear Walk, US 6,142,585.
5. Reducing Corrosion Fatigue and SCC Failures in 300M Steel Landing Gear Using Low Plasticity Burnishing, SAE 2007-01-3838, Lambda Technologies.
6. Cracking in Cargo Aircraft Main Landing Gear Truck Beams Due to Abusive Grinding Following Chromium Plating, Engineering Failure Analysis.
7. NTSB Investigations of High-Strength Steel Landing Gear Components Fracturing from Fatigue by Excessive Grinding, MDPI.
8. Fatigue Cracking Cited in FedEx MD-10F Landing Gear Collapse, Flight Safety Foundation.
9. SAS Bombardier Dash 8 Q400s Suffer Main Gear Failure Twice, FlightGlobal, September 2007. Danish AIB (Havarikommissionen) reports on the Aalborg, Palanga and Copenhagen events.
10. Address Fatigue Cracking in Cessna 210 Hydraulic Landing Gear Actuators, NTSB AIR-25-06.
11. Aviation Investigation Final Report, Delta Air Lines flight 1092, Boeing 717-200 N955AT, Charlotte, North Carolina, 28 June 2023, NTSB DCA23FA339.
12. Aviation Incident Final Report, Continental Airlines flight 1924, Boeing 737-3T0 N12318, Newark, New Jersey, 6 November 1998, NTSB NYC99IA024. Available through the NTSB CAROL query system.
13. Aviation Investigation Final Report, Cirrus SR22T N999VX, Paso Robles, California, 7 November 2015, NTSB WPR16IA025.
14. Aviation Incident Final Report, Boeing 737 nose landing gear overload failure during towing, NTSB NYC06IA207.
15. Numerical Prediction of Fatigue Life for Landing Gear Considering the Shock Absorber Travel, Aerospace, 2025.
16. Stress Corrosion Cracking, Vibrationdata.
17. Tom’s free ebooks, including shock and vibration response spectra, stress-velocity, and fatigue titles.
The gear model, drop simulation, SRS, shimmy stability boundary, rainflow damage summation and crack growth integration in this post were all computed for the demonstration airplane described above. The numbers are internally consistent with each other and with published test data where cited, but they are illustrative and are not a substitute for certification analysis on any specific gear.