Introduction
In the predawn hours of June 29, 2026, a severe thunderstorm complex swept across central South Dakota. The South Dakota Mesonet station at Highmore, in Hyde County, recorded a straight-line wind gust of 131 mph (58.6 m/s) at about 6:15–6:25 a.m. local time. The National Weather Service confirmed that the winds were non-tornadic. Meteorologists noted that, if verified, this may be the strongest directly measured straight-line thunderstorm gust in the United States since a 149.5 mph gust in Maryland in 1983, and the second-highest gust on record in South Dakota behind a 142 mph measurement at Lantry in 2010.
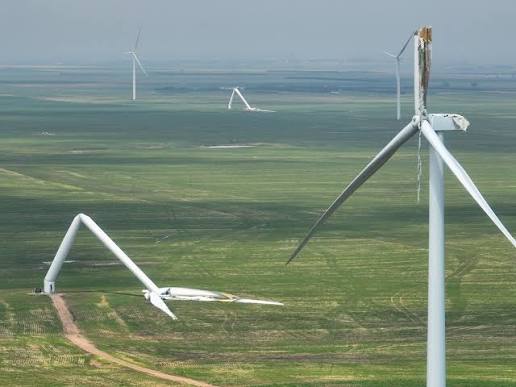
The storm inflicted severe damage on the South Dakota Wind Energy Center near Highmore, the state’s first major commercial wind project, commissioned in 2003 with 27 GE 1.5 MW turbines. Storm chasers and news outlets reported more than 20 of the 27 turbines destroyed or critically damaged, with towers buckled and blades broken. Two newer ENGIE wind farms in the same county, Triple H (250 MW) and North Bend (200 MW), also sustained damage.
Setting aside the energy-policy commentary that inevitably follows such an event, this incident is a superb structural dynamics case study. It raises the classic environments-engineering questions that we deal with in aerospace and defense work every day: How do we estimate a maximum predicted environment (MPE)? What return period or statistical enclosure should a design level represent? And what happens when nature delivers an event at, or beyond, the specified extreme?
The Measured Gust in Engineering Terms
The 131 mph figure converts to
\[ V = 131 \;\text{mph} \times 0.44704 \;\frac{\text{m/s}}{\text{mph}} \approx 58.6 \;\text{m/s} \]Mesonet anemometers are typically mounted at or near the standard 10 m reference height. Wind turbine design gusts, by contrast, are specified at hub height, which for a GE 1.5 MW machine is roughly 65 to 80 m. Mean wind speed increases with height per a power-law or logarithmic profile, while the gust factor decreases somewhat, so the hub-height 3-second gust during this event plausibly met or exceeded the 10 m measurement. The IEC extreme wind profile uses a power-law exponent of 0.11:
\[ V_{e50}(z) = 1.4 \, V_{ref} \left( \frac{z}{z_{hub}} \right)^{0.11} \]A further aggravating factor: severe thunderstorm outflows (downbursts and macrobursts, as in this event) do not obey the boundary-layer profile assumed in the standards. Downburst outflows tend to have their maximum velocity at low elevations, a “nose-shaped” profile, along with rapid direction changes. The synoptic-storm assumptions embedded in the design wind models are only an approximation for this storm type.
IEC 61400-1 Wind Classes and the Extreme Wind Model
The governing international design standard for large wind turbines is IEC 61400-1, Wind energy generation systems – Part 1: Design requirements. It defines standard wind turbine classes in terms of a reference wind speed \( V_{ref} \), the 10-minute mean at hub height with a 50-year return period. The extreme 3-second gust with a 50-year return period is taken as
\[ V_{e50} = 1.4 \, V_{ref} \]The following table summarizes the classes, with the 3-second design gusts converted to mph.
| Class | \( V_{ref} \) (m/s, 10-min mean) | \( V_{e50} \) (m/s, 3-s gust) | \( V_{e50} \) (mph) |
|---|---|---|---|
| I | 50 | 70.0 | 156.6 |
| II | 42.5 | 59.5 | 133.1 |
| III | 37.5 | 52.5 | 117.4 |
| T (typhoon, Ed. 4) | 57 | 79.8 | 178.5 |
| S | Site-specific values specified by the designer | ||
The GE 1.5 MW machines of the early-2000s era were typically certified to Class II or Class III depending on variant. If the Highmore machines were Class II units, then the measured 131 mph gust sat essentially at the 133 mph 50-year design gust, before accounting for hub-height amplification or downburst profile effects. If any were Class III (117 mph), the event exceeded the design gust outright. In other words, this storm delivered an environment at or beyond the maximum predicted environment for these turbines. Widespread structural failure under those conditions, while dramatic, is not an indictment of the design process. The design level was simply reached.
Parked-Turbine Design Load Cases
IEC 61400-1 evaluates extreme wind survival with the turbine parked (idling or stopped), primarily through two design load cases (DLC):
| DLC | Condition | Yaw Misalignment | Load Partial Safety Factor |
|---|---|---|---|
| 6.1 | Parked, 50-year extreme wind, grid available | ±15° | 1.35 |
| 6.2 | Parked, 50-year extreme wind, grid loss | ±180° | 1.10 |
DLC 6.2 deserves emphasis for this event. A violent storm that destroys transmission infrastructure also removes the grid power needed for active yaw control. A parked rotor caught broadside or with large yaw error experiences dramatically higher blade and tower loads than one yawed into the wind. News reports indicate that electricity was knocked out across the Highmore area during the storm. A realistic failure sequence is: grid loss, loss of yaw authority, wind direction shift within the macroburst outflow, large yaw misalignment, and then extreme aerodynamic loading on blades and tower at or above the 50-year gust. Buckled tube towers, folded “in half” as witnesses described, are consistent with tower bending overload, whether from direct drag loading or from blade-strike and rotor imbalance following blade failure.
Return Periods: The Civil Engineering Statistical Framework
Civil and wind engineering express design environments as return periods. A 50-year return period wind has an annual exceedance probability of \( p = 1/50 = 0.02 \). The probability of experiencing at least one exceedance during an exposure period of \( L \) years is
\[ P = 1 – \left( 1 – \frac{1}{T} \right)^{L} \]For the Highmore facility, in service from 2003 to 2026 (\( L = 23 \) years) against a 50-year design event:
\[ P = 1 – (0.98)^{23} \approx 0.37 \]A 37 percent chance of encountering the design-level event during the service life to date. Over a nominal 20-year design life the figure is about 33 percent. This surprises many people: the “50-year wind” is not a rare visitor over a multi-decade life. The structure is expected to survive it, with the partial safety factors providing margin, but events near the design level are an anticipated part of the statistical bargain, and events beyond it are always possible.
Extreme wind statistics are typically modeled with extreme value distributions. The Gumbel (Type I) distribution for the annual maximum wind speed is
\[ F(v) = \exp\!\left[ -\exp\!\left( -\frac{v – \mu}{\beta} \right) \right] \]where \( \mu \) is the location parameter and \( \beta \) the scale parameter, fit from annual-maximum wind records. The T-year wind is the speed with \( F(v) = 1 – 1/T \). A practical difficulty on the northern Great Plains is that thunderstorm downbursts and synoptic windstorms are drawn from different meteorological populations, and a mixed-distribution analysis is required to avoid underestimating the tail. A single Gumbel fit dominated by synoptic events can badly underpredict the thunderstorm-driven extremes, which is precisely the storm type that struck Highmore.
MPE and Normal Tolerance Limits: The Aerospace Framework
In aerospace shock and vibration work, we frame the same problem differently. Rather than a return period, we specify a maximum predicted environment as a normal tolerance limit on an ensemble of measured or predicted spectra, per NASA-HDBK-7005 and SMC-S-016. The two most common enclosures are:
- P95/50 — the level that bounds 95 percent of the population with 50 percent confidence, the customary MPE for random vibration.
- P99/90 — the level that bounds 99 percent of the population with 90 percent confidence, customary for pyrotechnic shock and other one-shot, failure-intolerant environments.
Assuming the environment levels (usually in dB, i.e., log-normal in physical units) are normally distributed, the one-sided normal tolerance limit is
\[ \text{NTL} = \bar{x} + k \, s \]where \( \bar{x} \) and \( s \) are the sample mean and standard deviation, and \( k \) is the one-sided tolerance factor from the noncentral t-distribution, a function of the fractile \( \beta \), the confidence \( \gamma \), and the sample size \( n \). Representative values:
| Enclosure | n = 10 | n → ∞ |
|---|---|---|
| P95/50 | ≈ 1.70 | 1.645 |
| P99/90 | ≈ 3.53 | 2.326 |
The small-sample penalty is severe for P99/90: with only ten flights or tests in the ensemble, the tolerance factor is roughly 50 percent larger than the infinite-sample value. Sparse data forces conservatism, which is exactly as it should be.
Comparing the Two Frameworks
The return-period and tolerance-limit approaches answer subtly different questions:
| Wind Engineering (IEC / ASCE) | Aerospace (NASA / SMC) | |
|---|---|---|
| Statistical basis | Extreme value distribution of annual maxima | Normal tolerance limit on ensemble of events |
| Design metric | Return period (50-yr, 700-yr, etc.) | Fractile / confidence (P95/50, P99/90) |
| Time dimension | Explicit — exposure duration matters | Implicit — per-event enclosure |
| Margin mechanism | Partial safety factors on loads and materials | Qualification margin (e.g., MPE + 3 dB or + 6 dB) plus duration factors |
| Confidence handling | Often embedded in characteristic values and load factors | Explicit via the tolerance factor k(n) |
A 50-year wind is roughly analogous to a high-fractile enclosure of the annual-maximum population, but the wind engineering framework then multiplies by partial safety factors (1.35 on loads in DLC 6.1) much as aerospace adds qualification margin above MPE. In both disciplines the design level is MPE plus deliberate margin, and in both disciplines a sufficiently extreme outlier can exceed it. The Highmore gust, likely the strongest measured non-tornadic thunderstorm gust in over four decades of U.S. records, was that outlier.
ASCE 7 Context
For conventional buildings, ASCE 7-22 maps basic design wind speeds as 3-second gusts at 10 m in Exposure C. Central South Dakota falls near 105–115 mph for Risk Category II structures, based on a 700-year mean recurrence interval used with strength design. The 131 mph measured gust exceeded even that ultimate-strength mapped value, which is consistent with the widespread damage to grain bins, roofs, and other conventional structures reported across the Highmore area. Note that wind turbines are designed to the IEC framework rather than ASCE 7, although ASCE/AWEA recommended practices bridge the two for foundations and permitting, as noted below.
U.S. and International Standards for Wind Turbines
| Standard | Scope |
|---|---|
| IEC 61400-1 | Design requirements for large wind turbines; wind classes, turbulence categories, design load cases, partial safety factors |
| IEC 61400-2 | Small wind turbines |
| IEC 61400-3-1 / -3-2 | Fixed and floating offshore wind turbines |
| IEC 61400-6 | Tower and foundation design requirements |
| IEC 61400-13 | Measurement of mechanical loads |
| IEC 61400-22 / IECRE OD-501 | Conformity testing and type certification |
| ANSI/ACP OCRP-1 (formerly AWEA) | U.S. offshore compliance recommended practices |
| ASCE/AWEA RP2011 | Recommended practice for compliance of large land-based wind turbine support structures with U.S. building codes; interfaces IEC loads with ASCE 7 and ACI/AISC design |
| DNV-ST-0437 | Loads and site conditions for wind turbines |
| DNV-ST-0126 | Support structures for wind turbines |
| ASCE 7-22 | Minimum design loads for buildings and other structures; wind hazard mapping context |
The 2003-vintage Highmore machines would have been certified under earlier editions of IEC 61400-1 (or the closely related Germanischer Lloyd guidelines), which used essentially the same class structure. The typhoon class T and refined turbulence models arrived in later editions, driven partly by turbine failures in Pacific typhoons, a reminder that these standards, like MIL-STD-810 in our world, evolve by absorbing the lessons of field failures.
Lessons Learned: The Case for Added Conservatism
It is tempting to close the book with “the design level was reached, case closed.” But in environments engineering, an event that lands at or beyond the specified extreme is precisely the trigger for asking whether the maximum predicted environment itself was underpredicted. Several arguments point toward a need for greater conservatism:
- The MPE, not the margin, may be the weak link. If the site’s extreme-wind statistics were derived from records dominated by synoptic windstorms, the thunderstorm downburst population is underrepresented in the fitted tail. The “50-year” gust used for turbine class selection is then biased low, and no partial safety factor applied downstream can repair a nonconservative environment estimate. This is the same lesson we teach in aerospace: margin stacked on an underpredicted MPE is false comfort. A mixed-population extreme value analysis, with separate Gumbel or GEV fits for convective and non-convective storms combined via their joint exceedance probability, should be standard practice for siting in the Great Plains severe-convective corridor.
- Class selection deserves a hard look in downburst country. Two events within the same state, 142 mph at Lantry in 2010 and 131 mph at Highmore in 2026, both exceed the Class II design gust and approach or exceed Class I territory at anemometer height. Where the convective climatology supports it, developers should consider Class I or site-specific Class S designs rather than defaulting to the class that the annual-mean wind resource suggests. The incremental capital cost must be weighed against a demonstrated regional hazard, not a smoothed national map.
- Sparse data demands larger enclosure factors. The aerospace P99/90 discipline is instructive: with a small ensemble, the one-sided tolerance factor grows steeply, forcing conservatism where knowledge is thin. High-quality anemometer records on the northern Plains span only a few decades, a short sample for estimating a 50-year (let alone 700-year) tail of a mixed distribution. A return-period estimate from 30 years of data carries wide confidence bounds, and design practice should enclose the upper confidence limit, not the median estimate, exactly as the k-factor does in the tolerance-limit framework.
- Nonstationarity erodes the return period. Return-period statistics assume a stationary climate. If severe convective wind events are trending in frequency or intensity, a “50-year” event calibrated on the historical record recurs more often than advertised, and the 37 percent lifetime exceedance probability computed above is a floor, not a ceiling.
- Design load case realism. DLC 6.2 caps the load safety factor at 1.10 on the reasoning that simultaneous grid loss and extreme wind is a rare coincidence. But in a severe thunderstorm, grid loss and extreme wind are not independent events; the same storm produces both. The joint probability argument that justifies the reduced factor deserves reexamination for convective wind climates, along with requirements for backup yaw power or fail-safe park positions.
None of this means the 2003-era designers erred against the standards of their day. It means the standards, and the site-hazard statistics feeding them, should continue to absorb field lessons, just as MIL-STD-810 and the NASA/SMC documents have done after every hard-won flight anomaly.
Closing Thoughts
Some takeaways for the structural dynamics community:
- The event environment was at or above the 50-year design gust for Class II machines, and well above Class III. Failures at that level reflect the statistical design bargain, not negligence.
- Exposure time matters. A 50-year event has roughly a one-in-three chance of occurring during a 20-plus-year service life. Owners and insurers should price that in.
- Grid loss and yaw misalignment (DLC 6.2) plausibly compounded the loading. Backup yaw power and robust park strategies deserve attention in severe-convective climates.
- Thunderstorm downbursts are a distinct statistical population with distinct velocity profiles. Mixed-population extreme value analysis is essential on the Great Plains.
- The parallels to aerospace MPE practice are strong: enclose the population (return period or P99/90), add margin (safety factors or qual dB), and accept, explicitly and quantitatively, the residual risk in the tail.
Nature ran a full-scale ultimate load test in Hyde County on June 29, and she did not follow the test plan.
References
- IEC 61400-1, Wind Energy Generation Systems – Part 1: Design Requirements, International Electrotechnical Commission.
- NASA-HDBK-7005, Dynamic Environmental Criteria, NASA, 2001.
- SMC-S-016, Test Requirements for Launch, Upper-Stage and Space Vehicles, U.S. Space Force Space and Missile Systems Center.
- ASCE/SEI 7-22, Minimum Design Loads and Associated Criteria for Buildings and Other Structures.
- ASCE/AWEA RP2011, Recommended Practice for Compliance of Large Land-Based Wind Turbine Support Structures.
- South Dakota Mesonet, Highmore station observation, June 29, 2026.
- National Weather Service, Aberdeen SD forecast office, storm reports, June 29, 2026.
📌 Further Reading: This article is part of our Wind Turbine Vibration & Dynamics Engineering Guide. Visit the hub page for more case studies and analysis on turbine fatigue and rotor mechanics.
— Tom Irvine, VibrationData