SKF Image
Before the Accelerometer: Touch, Hearing, Stethoscopes, and Stroboscopes in Machinery Vibration Monitoring
Long before FFT analyzers, wireless accelerometers, and machine-learning anomaly detection, machinery condition monitoring was done with the human hand, the human ear, a screwdriver, and a flashing lamp. These methods are still valuable today. An experienced millwright walking a plant floor performs a legitimate first-pass vibration survey with no instrumentation at all — and the humble mechanic’s stethoscope and stroboscope remain two of the highest ratio-of-insight-to-cost tools in the diagnostic kit.
This post covers the physics and practice of sensory and low-tech machinery monitoring: what each method can detect, its quantitative limits, and where it hands off to instrumented measurement.
1. Touch: The Hand as a Vibration Transducer
The skin contains four classes of mechanoreceptors. The two that matter for machinery work are the Meissner corpuscles, most sensitive from roughly 10 to 60 Hz, and the Pacinian corpuscles, which respond from about 60 Hz to 1000 Hz with peak sensitivity near 250 Hz. At that optimum frequency, the fingertip can detect displacement amplitudes below one micron. The hand is, in effect, a two-channel transducer covering nearly two decades of frequency — but with no frequency discrimination and a logarithmic, highly variable amplitude response.
Practical touch assessment on a bearing housing:
- Overall severity. The classic field calibration: vibration that is barely perceptible to the fingertips on a rigid bearing cap corresponds very roughly to 1–2 mm/s RMS velocity; vibration that feels distinctly rough is in the 7 mm/s range, near the ISO 20816 zone C/D boundary for many machine classes; and vibration that makes the hand tingle or is unpleasant to hold is well into the unacceptable zone. These are crude numbers, but they bracket the same decision thresholds a velocity meter reports.
- Temperature. The hand doubles as a thermometer. Skin can tolerate indefinite contact up to about 44°C; a surface you can hold for only a few seconds is roughly 60°C; one you cannot touch at all is above 70°C. A bearing housing that has trended from “warm” to “can’t hold” is telling you about lubrication or loading before any spectrum does.
- Character. Smooth sinusoidal unbalance feels different from the gritty, irregular texture of a rolling-element bearing defect or the sharp periodic tick of looseness. The hand performs a crude time-waveform analysis.
The limitations are equally important: touch cannot separate frequency components, is easily fooled by high-frequency content below the tactile band or above it, and puts the hand near rotating equipment. Never reach past a coupling guard to feel a bearing.
2. Hearing: Spectrum Analysis Between the Ears
The ear covers roughly 20 Hz to 20 kHz with peak sensitivity from 1 to 4 kHz — conveniently the band where gear mesh, blade passing, bearing defect harmonics, and cavitation live. Unlike the hand, the ear does discriminate frequency, and the auditory cortex is a superb change detector. Operators who live with a machine every day routinely report “it doesn’t sound right” before route-based monitoring flags anything.
A field vocabulary of machinery sounds:
- Unbalance and misalignment at 1x and 2x shaft speed are usually below or at the bottom of the audible range for slow machines; you feel these more than hear them.
- Gear problems present as a whine or growl at mesh frequency (teeth × RPM), with sidebands that the ear perceives as amplitude modulation — a rhythmic wow-wow at shaft speed.
- Rolling-element bearing defects in mid-life produce a whine or grinding at defect frequencies and their harmonics, typically 500 Hz to 5 kHz. Late-stage failure degenerates into broadband roar.
- Pump cavitation sounds like gravel or marbles passing through the casing — broadband crackle from bubble collapse.
- Beats. Two machines (or two engines) running at slightly different speeds produce an audible beat at
I analyzed exactly this phenomenon in a recent post on CRJ-900 cabin audio, where a ~50 RPM mismatch between the two engines’ N1 shafts produced a 0.83 Hz beat with nearly full modulation depth. The same effect on the plant floor — a slow throbbing from two nominally identical fans — is a free two-channel frequency comparison performed by ear.
The catch: industrial environments require hearing protection, which attenuates precisely the diagnostic band, and background noise masks single-machine signatures. This is where the stethoscope earns its keep.
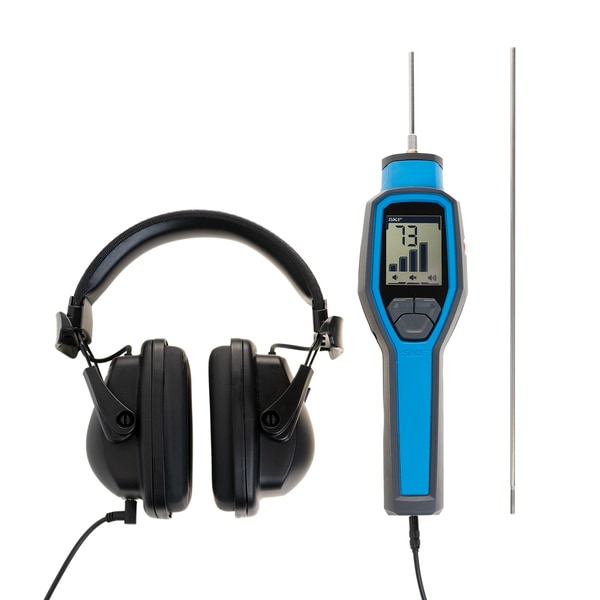
3. The Mechanic’s Stethoscope: Structure-Borne Listening
A mechanic’s stethoscope replaces the medical chest piece with a solid metal probe. Touched to a bearing cap, the probe conducts structure-borne vibration directly to the diaphragm, bypassing the airborne noise path entirely. The result is spatial selectivity: you hear this bearing, not the plant. The classic improvisation — a long screwdriver with the handle pressed against the ear (or against the jawbone for bone conduction) — works on the same principle and has diagnosed a century of bearing failures.
Technique matters:
- Probe the bearing load zone, with a firm, consistent contact force — contact stiffness affects the transmitted spectrum.
- Compare like to like: the same bearing position on an identical healthy machine, or the inboard versus outboard bearing on the same machine. The ear is a differential instrument.
- Listen through a full slow cycle of any beat or modulation. Periodicity is diagnostic: a click once per revolution suggests a single defect; random crackle suggests contamination or lubrication breakdown.
The electronic extension of the stethoscope is the ultrasonic instrument. Rolling-element bearings in the earliest stage of failure — microscopic subsurface fatigue and lubricant film breakdown — emit energy in the 30–40 kHz range, well above hearing, before anything appears in the conventional vibration spectrum. Ultrasonic guns heterodyne this band down to audible frequencies, letting the operator literally hear stage-1 bearing degradation and, just as usefully, hear the change in friction as grease is added — the basis of acoustic-assisted lubrication programs. The classic bearing failure progression runs: ultrasonic emission first, then excitation of bearing component natural frequencies, then discrete defect frequencies and harmonics in the spectrum, and finally broadband noise as the geometry disintegrates. Each stage moves down the frequency axis and up in severity.
4. The Stroboscope: Sampling With Light
A stroboscope freezes or slows apparent motion by illuminating a rotating or vibrating object with brief, periodic flashes. It is a sampling process — and everything a vibration analyst knows about sampling and aliasing applies directly.
If a shaft rotates at frequency \( f_s \) and the lamp flashes at \( f_f \), the apparent rotation frequency is
\[ f_{apparent} = f_s – n \, f_f, \quad n = \mathrm{round}\!\left( f_s / f_f \right) \]When \( f_f = f_s \), the shaft appears frozen. Flash slightly slower than shaft speed and the shaft appears to creep forward at \( f_s – f_f \); slightly faster and it creeps backward. This is precisely the aliasing phenomenon that corrupts undersampled digital data — the wagon-wheel effect — put to constructive use.
Field applications:
- Speed measurement. Adjust the flash rate until the shaft (or a reference mark) freezes as a single image. Beware submultiples: a shaft at 1800 RPM also freezes at flash rates of 900 and 600 RPM. The check is to double the flash rate — a true match then shows two stationary images 180° apart.
- Induction motor slip. Flash a rotor reference mark at the line-synchronous rate and the mark slowly precesses at the slip frequency — a direct visualization of \( f_{slip} = f_{sync} – f_{rotor} \). (Readers of my London Eye post will recall identifying a 2-pole induction motor at 49.1 Hz against a 50 Hz mains — that 0.9 Hz deficit is exactly the slip a strobe would display.)
- Phase for balancing. Before laser tachometers, single-plane field balancing used a strobe triggered by the vibration signal; the angular position at which the reference mark froze gave the phase reading for the influence-coefficient method.
- Motion studies. Detune the flash slightly and watch belt flap, coupling element behavior, chain whip, fan blade tracking, or resonant blade vibration in apparent slow motion. Structural deflection shapes that are invisible at speed become obvious at an apparent 1 Hz.
One safety rule outranks all technique: a strobed machine that appears stationary is still rotating at full speed. Rope off the area, keep hands and clothing clear, and never let anyone unfamiliar with stroboscopes near the work. Strobes can also trigger photosensitive epilepsy in the 5–30 Hz flash range.
5. Where the Senses Hand Off to Instrumentation
The sensory toolkit is a screening and localization method, not a trending method. Its weaknesses are the absence of amplitude calibration, no permanent record, no low-frequency capability below a few hertz, and dependence on operator experience. The proper workflow uses each layer for what it does best:
- Touch and hearing flag that something changed, and roughly where.
- Stethoscope and ultrasonic gun localize the fault to a component and stage the bearing failure.
- Stroboscope confirms speed, slip, and visible motion, and supplies phase.
- Accelerometer and FFT analyzer quantify severity against ISO 20816, resolve defect frequencies, and establish the trend that drives the repair decision.
The old methods survive because they exploit two instruments no vendor sells: a pattern-recognition system trained by years on the plant floor, and a change detector that runs continuously, for free, every time someone walks past the machine. Teach your analysts the spectrum — but teach them to put a hand on the bearing cap first.
References
- ISO 20816-1, Mechanical vibration — Measurement and evaluation of machine vibration — Part 1: General guidelines.
- J. Piersol and T. Paez (eds.), Harris’ Shock and Vibration Handbook, 6th ed., McGraw-Hill.
- R. B. Randall, Vibration-based Condition Monitoring, Wiley, 2011.
- S. J. Bolanowski et al., “Four channels mediate the mechanical aspects of touch,” J. Acoust. Soc. Am., Vol. 84, 1988.
- VibrationData blog, “CRJ-900 Cabin Audio: Engine Beat Frequency Analysis,” June 2026.
- VibrationData blog, “London Eye Field Study: Wheel Structure and Capsule Acoustics,” July 2026.