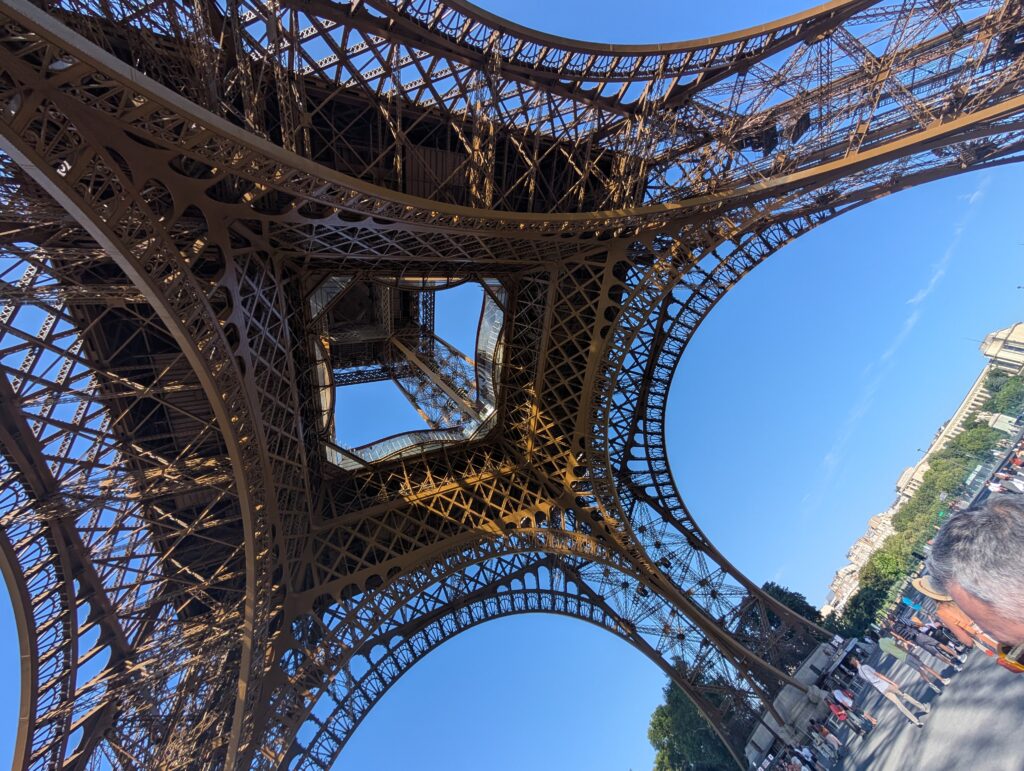
Measuring the Eiffel Tower’s Natural Frequencies with a Smartphone
Two short accelerometer records on the summit deck captured five of the tower’s first six modes — with the fundamental within one percent of the published seismometer survey.
The Measurement
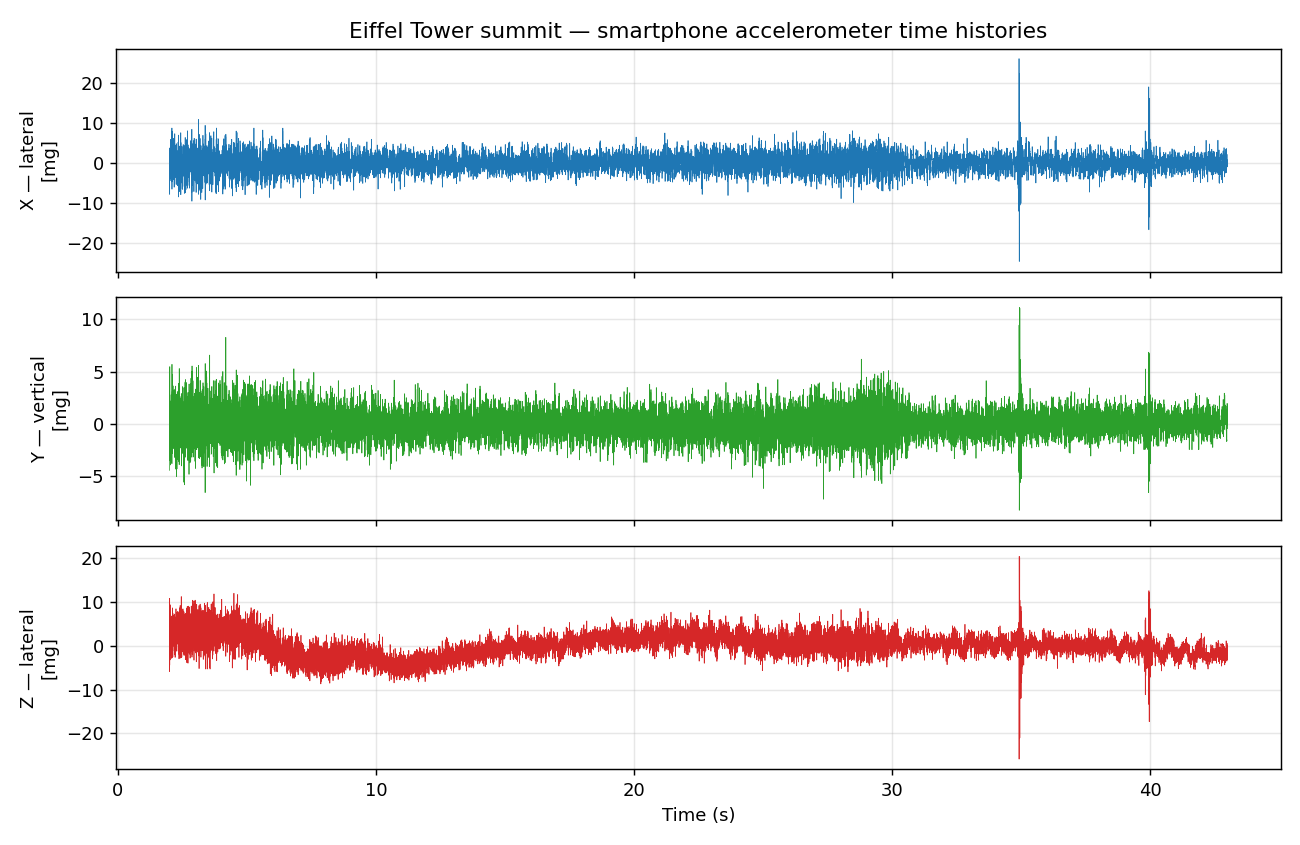
Following my London Eye ride measurements last week, I took accelerometer data at the summit of the Eiffel Tower (public observation level, ~276 m) using the Keuwl accelerometer app on my Android phone: three axes at 400 samples per second, with Y vertical and X and Z lateral. I made two independent recordings of about 50 seconds each, roughly 14 minutes apart. Conditions: very light breeze, normal tourist foot traffic, elevators running. In each record the first and last two seconds were discarded, and the final few seconds — hand-motion transients from picking the phone up — were removed, leaving 41 and 44 seconds of clean data.
Ambient levels were modest: about 2–3 mg RMS on the lateral axes and 1.4 mg RMS vertical.
The Reference: A Seismometer in a Shopping Bag
The benchmark for this exercise is a delightful paper: Castellaro, Perricone, Bartolomei & Isani, “Dynamic characterization of the Eiffel tower,” Engineering Structures 126 (2016). Two of the authors climbed the tower in November 2015 with a pocket Tromino seismometer hidden in a paper shopping bag (to keep curious tourists at a distance) and, in under an hour of ambient recordings at three levels, identified the tower’s first six modes. They then built a finite element model, using the mode frequencies to back out how much non-structural mass the tower has gained since 1889 (about 1,600 tonnes of it).
| Mode | Frequency | Mechanism |
|---|---|---|
| 1 | 0.32 Hz | Horizontal bending I |
| 2 | 1.0 Hz | Horizontal bending II |
| 3 | 1.2 Hz | Torsion I |
| 4 | 1.4 Hz | Horizontal bending III |
| 5 | 1.7 Hz | Horizontal bending IV |
| 6 | 2.1 Hz | Torsion II |
They also measured a 2 Hz subsoil resonance in the Champ de Mars sediments (~50 m to bedrock), and noted that the first bending mode moves about 40% of the tower’s mass and involves measurable foundation rocking — the soil participates in the tower’s fundamental sway.
Results: Five of Six Modes
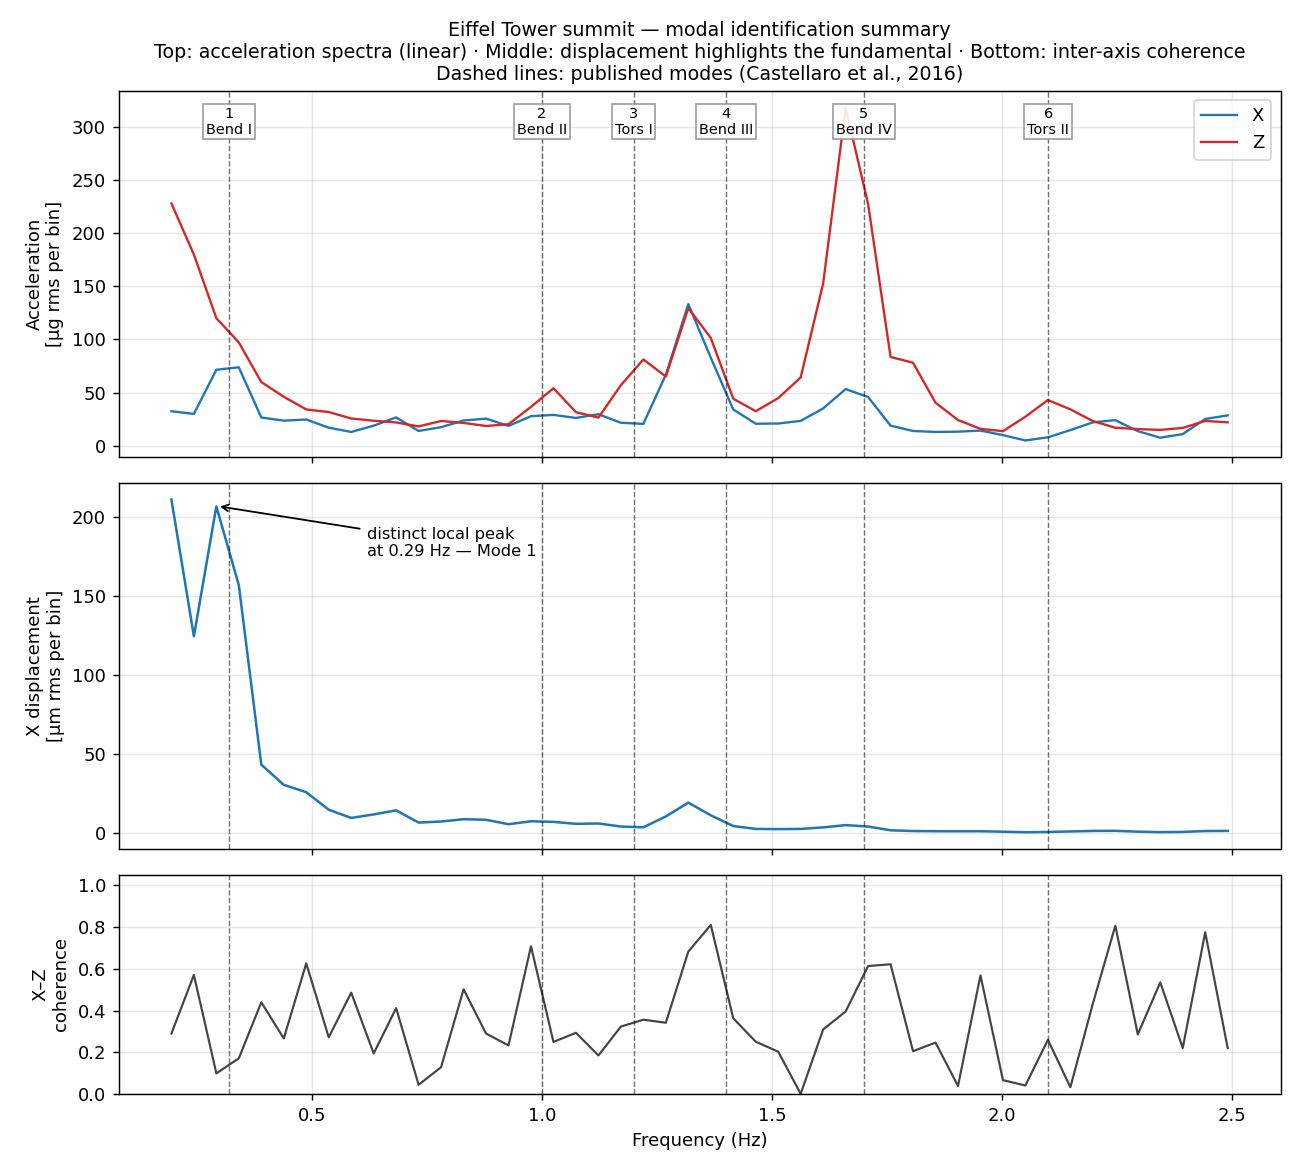
The identification rests on three lines of evidence, assembled in Figure 2 (Welch-averaged spectra from the 41-second clean record). First, the linear acceleration spectra of both lateral axes show clean peaks at 1.0, 1.2–1.3, and 1.66 Hz standing well above a flat background. Second, converting to a displacement spectrum (dividing by ω²) flips the emphasis to low frequency: the fundamental emerges as a distinct local peak near 200 µm — an order of magnitude above everything from 0.5 to 2.5 Hz, and a genuine local maximum rather than a drift skirt (the neighboring bins on both sides are lower; the Z axis is drift-dominated below 0.25 Hz and is omitted from this panel). Third, the coherence between the two lateral axes runs 0.6–0.8 at the mode frequencies — sensor noise is incoherent between axes, so shared, coherent peaks are structural.
| Measured (axis) | Published | Mode | Diff. |
|---|---|---|---|
| 0.317 Hz (X, pooled records) | 0.32 Hz | Bending I | −0.8% |
| 1.03 Hz (Z) | 1.0 Hz | Bending II | +3% |
| 1.22 Hz (Z) | 1.2 Hz | Torsion I | +2% |
| 1.32 Hz (X, Z) | 1.4 Hz | Bending III | −6% |
| 1.66 Hz (X, Z) | 1.7 Hz | Bending IV | −2% |
Torsion at the periphery. The torsion mode (1.22 Hz) appears in my lateral data because the public summit deck is at the tower’s periphery, where torsional motion produces tangential acceleration. Castellaro et al. used the same signature in reverse — torsion modes vanish at the center of a platform — to classify their modes.
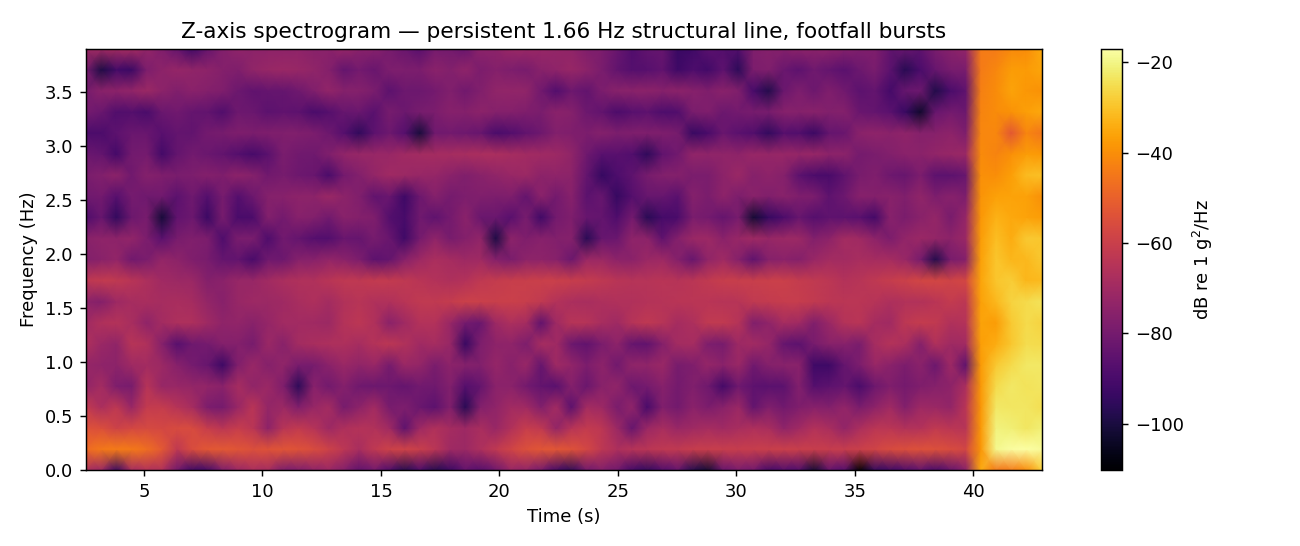
The strongest line: 1.66 Hz. The dominant structural peak is bending mode IV, persistent across the whole record in the Z spectrogram (Fig. 5). This makes physical sense from the excitation side: normal walking rates span roughly 1.6–2.4 steps per second, so tourist footfall on the decks pumps energy directly into the 1.4 and 1.7 Hz modes, while the 0.32 Hz fundamental relies mostly on wind — which today was nearly absent. The mode shapes matter too: higher bending modes have more curvature (and more response) near the top where I was standing.
The missing mode. Torsion II at 2.1 Hz did not appear cleanly — possibly buried under footfall energy, whose band spans right across it.
Sharpening Mode 1: Pooling Two Records
A single 40-second record holds only about 13 cycles of the 0.32 Hz fundamental, so the Welch spectrum’s 0.049 Hz bins cannot localize the peak sharply — my first estimate landed at 0.293 Hz, an awkward −8% from the published value. The second, independent record taken 14 minutes earlier provided the fix.
One caution up front: splicing two non-contiguous records end-to-end does not genuinely improve spectral resolution — resolution is set by continuous record length, and the two records have no phase coherence across the 14-minute gap. What the second record legitimately buys is more averaging, and that makes a finer segment length affordable. The procedure: detrend and high-pass filter both X-axis records at 0.1 Hz (4th-order Butterworth, zero-phase) to remove drift, then compute Welch spectra with 41-second segments and pool the averages across both records. That yields 0.024 Hz bins with three averages — a resolution that was too noisy to use with either record alone.
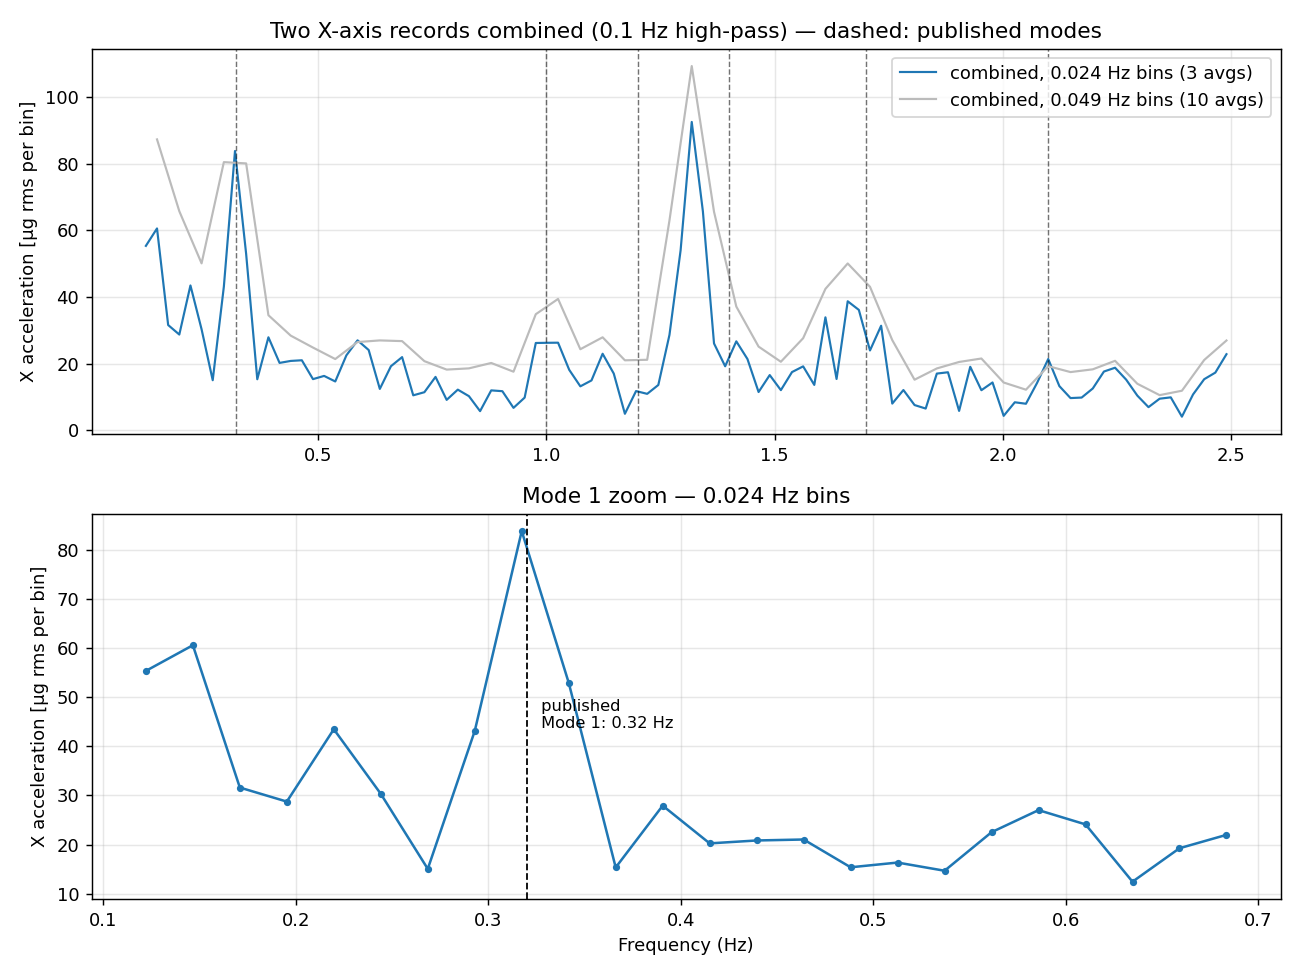
At the finer resolution the fundamental resolves to a sharp, isolated local maximum at 0.317 Hz — 84 µg, bracketed by 15 µg valleys on both sides — and the earlier 0.293 Hz estimate is revealed as a bin-centering artifact: the true peak sat between the coarse bins.
Measured fundamental: 0.317 Hz. Published: 0.32 Hz. Difference: 0.8%.
The reproducibility itself is evidence: two independent records, 14 minutes apart, show the mode-1 energy concentration at nearly identical amplitude. Integrating the mode-1 band acceleration gives a summit sway displacement of roughly 0.2 mm RMS — the tower barely moving in the light breeze, exactly as conditions would suggest.
What the Vertical Axis Saw
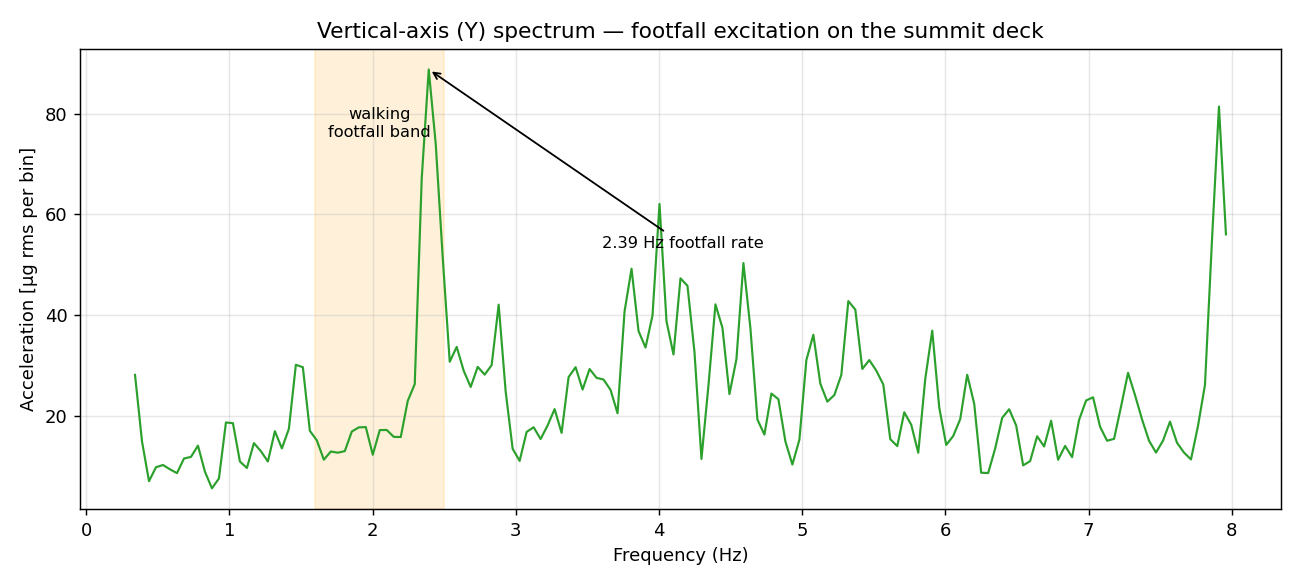
The vertical (Y) axis tells a different story, just as it did on the London Eye: the accelerometer’s vertical channel is dominated by local deck excitation rather than global tower modes. The main vertical peak is at 2.39 Hz — a brisk walking footfall rate — with additional peaks at 3.8–4.0 Hz that are plausibly local deck panel modes or elevator machinery transmitted up the pillars, though I can’t attribute them confidently from these records. The footfall impulses are clearly visible as brief broadband bursts in the vertical time history.
The Larger Point
A century-old, 10,000-tonne puddled-iron lattice tower reveals five of its first six natural frequencies — the fundamental to within one percent — to a phone lying on the deck for a couple of minutes total. Ambient modal identification has become genuinely democratic: Castellaro’s team needed a scientific seismometer in 2015; today the sensor is in your pocket. The physics doing the heavy lifting is the same in both cases — a lightly damped structure is a narrowband mechanical filter, and any broadband ambient excitation (wind, footfall, machinery) is enough to make its modes stand up out of the noise floor.
For the underlying methods — PSDs, natural frequency estimation, and structural dynamics — see my free ebooks: blog.vibrationdata.com/toms-ebooks · vibrationdata.com
Sources
- S. Castellaro, L. Perricone, M. Bartolomei, S. Isani, “Dynamic characterization of the Eiffel tower,” Engineering Structures 126 (2016) 628–640 — sciencedirect.com/science/article/abs/pii/S0141029616304242
- G. Eiffel, La Tour de 300 mètres (1900) — original structural drawings referenced therein