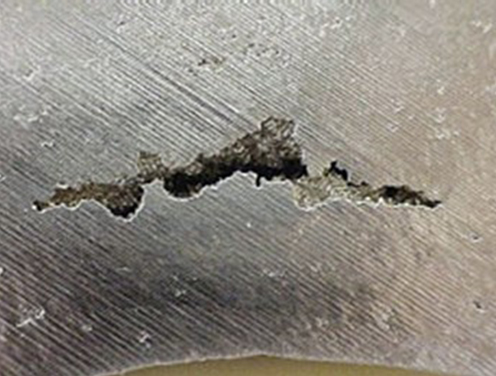
Image courtesy of: https://incastt.com/inclusion-defects-in-investment-casting/
Non-metallic inclusions are unavoidable by-products of steelmaking, casting, and welding. They range in size from sub-micron oxide clusters to hundred-micron sulfide stringers, but their fatigue consequence is disproportionate to their size. This post catalogs the common inclusion species by alloy family, then develops the Murakami fracture-mechanics framework that turns inclusion geometry into a quantitative fatigue limit prediction.
1. What Is an Inclusion?
An inclusion is a solid, non-metallic particle embedded in the metal matrix. It forms during solidification or welding when dissolved oxygen, sulfur, nitrogen, or alloying additions precipitate before or during solidification. Inclusions differ from voids (porosity) in that they are chemically distinct solid phases. Their fatigue significance comes from three sources:
- Elastic mismatch — the inclusion modulus differs from the matrix, concentrating stress at the interface.
- Interface weakness — poor bonding allows decohesion under cyclic loading, nucleating a microcrack.
- Stress-raising geometry — elongated stringers or faceted particles create local stress intensity.
2. Inclusion Chemistry by Alloy System
2.1 Carbon and Low-Alloy Steels
Steel inclusions are the most studied because rotating-beam fatigue specimens frequently fail at them in the high-cycle regime.
| Species | Formula | Origin | Fatigue role |
|---|---|---|---|
| Alumina | Al2O3 | Deoxidation with aluminum | Hard, brittle; high elastic mismatch; primary VHCF initiator in bearing steels |
| Manganese sulfide | MnS | Solidification of dissolved S | Deformable stringer; elongates in rolling direction; severe anisotropy in transverse fatigue |
| Calcium aluminate | CaO·Al2O3 (C12A7) | Ca-treatment of Al-killed steel | Globularizes MnS; reduces stringer aspect ratio; generally benign if small |
| Titanium nitride | TiN | Ti microalloying; N in solution | Cubic, faceted; very high hardness (~2000 HV); potent crack initiator |
| Spinel | MgO·Al2O3 | Refractory contamination | Cluster morphology; large effective √area; associated with gear and bearing failures |
| Silica | SiO2 | Si deoxidation | Glassy at temperature; can elongate; stress concentration depends on cooling rate |
Fish-eye fracture in bearing steels almost always nucleates at Al2O3 or TiN inclusions in the VHCF regime (N > 107 cycles).
2.2 Stainless Steels
| Species | Formula | Origin | Fatigue role |
|---|---|---|---|
| Chromium oxide | Cr2O3 | High Cr content; dissolved O | Brittle; interface decohesion; significant in duplex grades under corrosion-fatigue |
| Sigma phase (σ) | Fe–Cr intermetallic | Long-time exposure 600–900 °C | Brittle precipitate at grain boundaries; severely degrades toughness and fatigue resistance |
| Delta ferrite stringers | bcc Fe–Cr phase | Retained from solidification in austenitic grades | Acts as initiation site when oxidized; anisotropic fatigue response in wrought bar |
| MnS | MnS | Same as carbon steel; worse in free-machining grades | Same stringer mechanism; particularly damaging in 303/416 free-machining variants |
2.3 Aluminum Alloys
| Species | Formula / Type | Origin | Fatigue role |
|---|---|---|---|
| Iron-bearing intermetallics | Al3Fe, Al6(FeMn), β-Al5FeSi | Fe impurity in Al ingot | Brittle platelets; primary fatigue initiator in cast and wrought Al; β-phase especially damaging |
| Silicon eutectic | Si (acicular) | Eutectic solidification in Al–Si castings | Coarse acicular Si particles crack under cyclic load; modification with Sr or Na reduces aspect ratio |
| Oxide bifilms | Al2O3 double-layer | Turbulent filling; surface oxide folded in | Un-bonded interface; effectively a pre-existing crack; Griffith-critical at very small sizes |
| Constituent particles | Al2CuMg (S-phase), MgZn2 (η) | Alloying; precipitate coarsening | Coarse particles at grain boundaries fracture early; dominant in 2xxx and 7xxx fatigue crack initiation |
2.4 Titanium Alloys
| Species | Formula / Type | Origin | Fatigue role |
|---|---|---|---|
| Hard-alpha defects | α-Ti stabilized by N, O | N or O contamination of VAR electrode | Brittle, high-hardness zone; fracture toughness near zero; catastrophic initiator; implicated in engine disk failures (UA 232, Sioux City 1989) |
| Ti2NiOx | Ti–Ni–O ternary oxide | Ni contamination + O; seen in PM or recycled Ti | Brittle oxide particle; potent fatigue initiator; relevant to VHCF scatter in Ti-6Al-4V |
| TiN | TiN | N in VAR melt pool | Same as in steels; faceted cubic morphology; crack initiator in rotating bending |
| Beta fleck | Segregated β-stabilizer rich zone | Macro-segregation in large VAR ingots | Lower fatigue limit than surrounding matrix; crack nucleation in billet if un-detected |
2.5 Weld Metal and Heat-Affected Zone
Fusion welding introduces inclusions from electrode coatings, shielding gas, base metal oxides, and solidification reactions. The HAZ can also generate embrittled zones that behave like inclusions from a fatigue standpoint.
| Species | Origin | Fatigue role |
|---|---|---|
| Slag inclusions (SiO2–MnO–Al2O3 glass) | Incomplete slag removal between passes; SMAW/FCAW | Large size (50–500 µm); sharp corners; primary weld fatigue initiator |
| Oxide films | Inadequate shielding; surface contamination | Planar defects; bifilm mechanism; act as pre-cracks |
| Tungsten inclusions | Electrode contact in GTAW | Dense, brittle particle; visible on radiograph; very high elastic mismatch |
| Porosity | Dissolved H2 or CO entrapment | Acts as stress concentrator; cylindrical pores more damaging than spherical |
| Acicular ferrite nuclei | Oxide/sulfide particles seeding intragranular ferrite in weld metal | Beneficial: fine interlocking ferrite improves toughness when well-distributed |
| HAZ liquation cracks | Low-melting grain-boundary films in Ni superalloys and some stainless | Pre-existing micro-cracks; treated as inclusions in fracture mechanics life assessment |
3. Murakami’s √area Framework
Yukitaka Murakami (Kyushu University) demonstrated that the fatigue limit of a specimen containing an inclusion is governed not by the inclusion’s chemical identity but by its projected area perpendicular to the maximum principal stress, denoted √area. This single geometric parameter collapses data from many alloy-inclusion combinations onto common design curves.
3.1 Stress Intensity Factor Range at an Inclusion
For a small, roughly equiaxed defect the stress intensity factor range \(\Delta K\) depends on its location relative to the free surface. Murakami established two expressions:
Surface defect:
\[ \Delta K = 0.65 \cdot \Delta S \cdot \sqrt{\pi \sqrt{\text{area}}} \]Internal (subsurface) defect:
\[ \Delta K = 0.50 \cdot \Delta S \cdot \sqrt{\pi \sqrt{\text{area}}} \]where \(\Delta S\) is the applied nominal stress range and √area is in metres when \(\Delta K\) is in MPa√m.
The coefficient difference (0.65 vs. 0.50) reflects the free-surface amplification: a surface-breaking defect experiences a higher local stress intensity than an identically-sized internal defect at the same applied stress. The factor 0.65 corresponds to a half-penny crack with one face on the free surface; 0.50 corresponds to a fully embedded penny-shaped crack.
The √area parameter itself is defined as the square root of the projected area of the inclusion (or cluster of inclusions) measured on the plane normal to the maximum principal stress. For a sphere of diameter \(d\), √area = √(πd²/4) ≈ 0.886d. For an elongated stringer of length \(2a\) and width \(2b\), √area = √(πab).
3.2 Projection Along the Stress Direction
As illustrated in the Politecnico Milano slide above, when an inclusion is arbitrarily oriented in three-dimensional space, its effective size is the projection of its cross-section onto the plane perpendicular to the applied stress direction. This projection—labeled PZ in the 3-D schematic—is the quantity whose square root enters the Murakami equations. The projections PX and PY onto the other two coordinate planes are irrelevant to Mode I fatigue; only PZ matters for opening-mode crack growth.
Practically, metallographic sectioning on the plane of maximum principal stress (the fracture surface) is used to measure √area from SEM fractographs. For life-assessment of uninspected hardware, the extreme-value distribution of √area from a population of metallographic cross-sections is used to estimate the maximum defect likely to exist in the critical volume—the same logic used in the Gumbel or generalized extreme-value (GEV) treatment of inclusion statistics.
3.3 Fatigue Limit from Inclusion Size and Hardness
Murakami extended the framework to predict the fatigue limit \(\sigma_w\) of a specimen containing a defect of measured √area:
\[ \sigma_w = \frac{C (HV + 120)}{(\sqrt{\text{area}})^{1/6}} \]where HV is Vickers hardness and \(C\) = 1.43 for surface defects, 1.56 for internal defects (units: MPa, µm).
Key observations:
- Fatigue limit decreases as √area increases — larger inclusions are more damaging.
- Fatigue limit increases with hardness — but the benefit saturates for high-hardness steels because inclusion sensitivity increases with hardness (the notch sensitivity factor \(q \to 1\) at high HV).
- The exponent 1/6 is weak — a factor-of-64 increase in inclusion area reduces the fatigue limit by only a factor of 2. Size matters, but the effect is gradual.
3.4 Kitagawa–Takahashi Connection
The Murakami √area equations also underpin the Kitagawa–Takahashi diagram. The threshold stress intensity range \(\Delta K_{th}\) defines a critical inclusion size below which a defect is non-propagating:
\[ \sqrt{\text{area}}_{\,0} = \frac{1}{\pi} \left( \frac{\Delta K_{th}}{0.65 \cdot \Delta S} \right)^2 \]For bearing steels, \(\Delta K_{th} \approx 0.28\)–\(0.30\) MPa√m. At a stress range of 700 MPa, this gives √area\(_0\) ≈ 5–7 µm — meaning inclusions smaller than ~5 µm effective diameter are essentially harmless, while those above ~30 µm dramatically reduce the fatigue limit. This quantitative threshold directly motivates the vacuum arc remelting (VAR) and electroslag remelting (ESR) cleanliness requirements in aerospace bearing and gear specifications.
4. Life Reduction by Inclusion Type: Representative Data
| Alloy / Inclusion | Typical √area (µm) | HV | Predicted σw (MPa) | Clean-metal σw (MPa) | Life reduction factor |
|---|---|---|---|---|---|
| 52100 bearing steel / Al2O3 | 20 | 700 | 690 | 900 | ~1.3× |
| 52100 bearing steel / Al2O3 | 60 | 700 | 510 | 900 | ~3–5× in life |
| Ti-6Al-4V / hard-alpha | 300 | 380 | 220 | 480 | order of magnitude |
| Al 7075-T6 / Fe-intermetallic | 40 | 175 | 105 | 160 | ~2–4× in life |
| 316L stainless / MnS stringer | 80 (transverse) | 200 | 115 | 190 | ~5–10× in life |
| Weld metal / slag inclusion | 150 | 220 | 105 | 200 | >10× in life |
Life reduction factors are approximate; actual values depend on R-ratio, environment, and inclusion morphology.
5. Damage-Tolerant Design Workflow
The Murakami framework integrates naturally with Paris Law fatigue crack growth:
- Characterize inclusion population — extreme-value statistics on metallographic sections give the maximum expected √area in the critical volume.
- Set EIFS — use Murakami’s √area\(_0\) threshold or NDE detection limit as the equivalent initial flaw size.
- Compute \(\Delta K\) at EIFS — using the 0.65 or 0.50 coefficient as appropriate for surface vs. internal.
- Integrate Paris Law — \(da/dN = C(\Delta K)^m\) from EIFS to critical crack size \(a_c = K_{IC}^2 / (\pi \sigma_{max}^2)\).
- Apply scatter factor — typically 4× on life for fracture-critical aerospace components.
This approach replaces the traditional smooth-bar S-N curve with a physically motivated, inspection-linked life model that explicitly accounts for material cleanliness.
6. Summary
Inclusions are the dominant fatigue crack initiation sites in high-cycle and very-high-cycle regimes across all engineering alloy families. Their chemical identity (Al2O3, MnS, TiN, hard-alpha, slag) determines their elastic mismatch and interface strength, but it is their projected area—√area—that controls the stress intensity range and, therefore, the fatigue limit. Murakami’s twin equations (\(\Delta K\) = 0.65 or 0.50 · ΔS · √(π√area)) provide a concise, experimentally validated bridge between inclusion measurement and fracture mechanics life prediction. Cleanliness standards in VAR/ESR melting, Ca-treatment of steels, and weld procedure qualification are all ultimately traceable to controlling √area below the Kitagawa–Takahashi threshold for the design stress range.
Tom Irvine | VibrationData.com | Structural Dynamics, Shock, Vibration & Acoustics