Introduction
Researchers at the University of Southampton and The British Museum have applied two familiar tools from the aerospace shock and vibration world — the shock response spectrum (SRS) and the vibration response spectrum (VRS) — to a very different problem: deciding whether fragile museum artifacts can safely travel by road, rail, sea, and air.
The paper is:
T. W. J. Hutchin, T. P. Waters, and V. Kotonski, “Shock and vibration response of museum objects during transportation,” Journal of Physics: Conference Series 2647, 222009, 2024. Presented at the XII International Conference on Structural Dynamics (EURODYN). Open access under CC BY 4.0:
https://eprints.soton.ac.uk/492113/1/Hutchin_2024_J._Phys._Conf._Ser._2647_222009.pdf
I will admit a personal interest. The authors trace the SRS to Biot’s pioneering 1932 work, and then credit the vibration response spectrum as a much later development — citing my Vibrationdata VRS tutorial as its origin (I popularized the VRS but did not invent it). It is gratifying to see the VRS earn its keep in a domain as far from launch vehicles as the conservation lab of the British Museum.
The Problem
Museums routinely ship objects between storage facilities, laboratories, galleries, and international loan venues. Many artifacts carry incipient damage — cracks, loose joints, partial delamination, failing repairs — that transit shock and vibration can worsen. The decision of which objects are safe to travel has traditionally rested on conservator experience and professional judgment rather than engineering analysis.
The Southampton / British Museum research program aims to put that judgment on a quantitative footing. The central question of this paper: which transport modes are potentially the most damaging?
Test Methodology
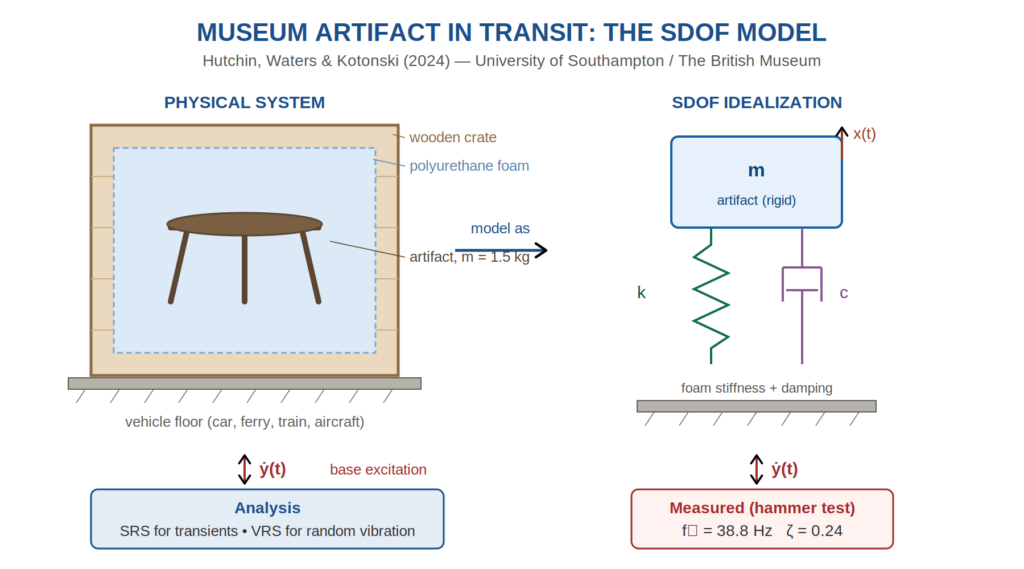
The test object was a wooden stool from the museum’s handling collection, roughly 0.4 m in diameter with a mass of 1.5 kg, packed by museum specialists in cut-to-form polyurethane foam inside a wooden crate.
Modal characterization
An instrumented hammer test on the packaged object identified a fundamental mounting resonance of 38.8 Hz with a damping ratio of $\zeta = 0.24$. This mode is the rigid object bouncing on the stiffness of its foam packaging — well below the first elastic mode of the stool itself. Two other heavily damped modes appeared near 85 and 235 Hz.
Transport measurements
Vibration was logged in two campaigns using MSR165 data loggers (14-bit, ±15 g, 1600 sps, giving a usable band of 0 to 800 Hz):
- Air: return flights between London Stansted and Malaga, with a logger fixed to a passenger seat base rail. One flight was turbulent throughout; the other was smooth. Comparable single-aisle jets from different manufacturers.
- Road, ferry, and rail: a return trip from Essex to Calais with the instrumented crate riding in the luggage compartment of a Volvo XC70, including the Channel ferry and the Eurotunnel. Loading and unloading of the car onto ferry and train were deliberately captured to include handling shocks.
Loggers were placed on both the crate and the object inside — a key detail, because it allowed the SRS/VRS predictions to be checked against direct measurements on the artifact.
Kurtosis as a Traffic Cop
Before computing spectra, the authors used a moving-average kurtosis to sort each record into impulsive and stationary-random segments. Kurtosis is the normalized fourth moment; a Gaussian random signal has a kurtosis of 3, and values well above 3 flag transient events.
The flight data shows this beautifully. During cruise, kurtosis hovers near 3 — jet noise and turbulence produce nearly Gaussian random vibration. During takeoff and landing, kurtosis spikes well above 3, flagging those phases as shock-like. The impulsive segments are candidates for SRS treatment; the Gaussian segments for VRS treatment. This is exactly the discrimination logic I recommend in my own courses: kurtosis first, then choose the right spectral tool.
SRS and VRS Results
Both spectra were computed for $\zeta = 0.24$, matching the measured mounting resonance damping, over 1 to 800 Hz.
Flight comparison
Below about 30 Hz, the turbulent and smooth flights produced similar peak responses. Above 30 Hz, the turbulent flight was clearly harsher. For a hypothetical object with a 38 Hz mounting resonance, the SRS predicted peak accelerations of about 1.9 g on the turbulent flight versus 1.5 g on the smooth one. The VRS told the same story in RMS terms, with the turbulent flight elevating the response of any system above roughly 60 Hz.
Road vs. ferry vs. rail
The VRS ranked the car journey as three to four times harsher in RMS acceleration than either the ferry or the train. All three curves showed a peak near 10 to 20 Hz attributable to crate resonances, plus a small 2 Hz peak likely from the vehicle bounce mode on its suspension — a nice everyday example of the sprung-mass dynamics we usually discuss in the context of isolation systems.
Prediction accuracy
| Transport | SRS Peak Error | VRS RMS Error |
|---|---|---|
| Road | −15.5% | −7.0% |
| Ferry | +9.5% | −16.7% |
| Train | +8.2% | −8.1% |
Both spectra landed within about ±17% of the measured values on the object itself, and the VRS correctly rank-ordered the three transport modes. That is a respectable showing given that the single-degree-of-freedom assumption underlying both tools is strained here: with $\zeta = 0.24$, the modes are heavily damped and the true response is multi-modal.
The design takeaway. Across every transport mode tested, peak and RMS response drops substantially if the mounting resonance of the object in its packaging is brought below about 10 Hz. Softer foam achieves this at the cost of larger static deflection under the object’s weight — the same trade every isolation engineer faces, whether the payload is an avionics box or a Bronze Age artifact.
Commentary
A few observations from my side of the fence:
1. The VRS was built for exactly this. The VRS gives the RMS response of a family of SDOF systems to a base-input PSD. Its original use case was enveloping flight vibration for avionics design. The museum application is structurally identical: the artifact-in-foam is the SDOF system, the crate acceleration is the base input, and the question is what response the payload sees. The tool transferred without modification.
2. Handling shocks dominate more than transport mode. The SRS curves for road, ferry, and rail were remarkably similar, which the authors attribute to loading and unloading shocks appearing in all three legs. This echoes the packaging industry’s long-standing finding that the drop at the loading dock, not the highway miles, sizes the cushioning. Conservators worried about the flight should perhaps worry more about the forklift.
3. High damping is a double-edged sword. The foam’s $\zeta = 0.24$ blunts resonant amplification but violates the light-damping assumptions baked into standard SRS/VRS practice (Q = 10). The authors are candid about this. The 10 to 17% prediction errors are acceptable for rank-ordering transport severity, but anyone using these tools for a fragility certification should keep the multi-modal, high-damping caveat in view.
4. A model for the heritage sector. Prior museum studies logged time histories and PSDs but rarely closed the loop between prediction and direct measurement on the object. This paper does, and the framework — kurtosis segmentation, SRS for transients, VRS for stationary segments, validation on the payload — is a template other institutions can copy with a few hundred dollars of data loggers.
Closing
Biot gave us the SRS in 1932 to understand earthquakes. Seventy years later the VRS followed for random vibration. It is a pleasure to see both spectra now helping decide whether a wooden stool — or someday a far more precious object — can safely ride a ferry across the Channel. Good tools travel well.
Reference
T. W. J. Hutchin, T. P. Waters, and V. Kotonski, “Shock and vibration response of museum objects during transportation,” J. Phys.: Conf. Ser. 2647, 222009, 2024. Download PDF (open access)
Related Vibrationdata tutorials: An Introduction to the Vibration Response Spectrum and An Introduction to the Shock Response Spectrum.
— Tom Irvine, VibrationData
Free ebooks: https://blog.vibrationdata.com/2025/11/27/toms-ebooks/