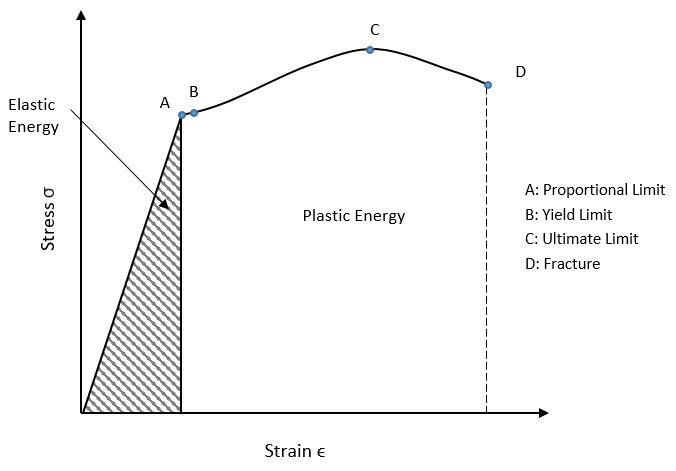
The plot shows the applied strain on the horizontal axis and the resisting stress on the vertical axis. The area inside the triangle represents the maximum energy that can be absorbed elastically, if the member is strained up to its proportional limit stress. The member will return to its original position when the load is removed. This area is also referred to as resilience, or modulus of resilience.
The yield stress, denoted σy, is the stress needed to induce plastic deformation in the specimen. The yield stress is taken to be the stress needed to induce a specified amount of permanent strain, typically 0.2%, since it is often difficult to pinpoint the exact stress at which plastic deformation begins.
The remaining area, which is not cross-hatched, represents the plastic (or inelastic) energy if the member is strained up to its fracture point. This area is also referred to as the toughness, or modulus of toughness.
A large amount of energy can be absorbed, if permanent, plastic deformation is acceptable.
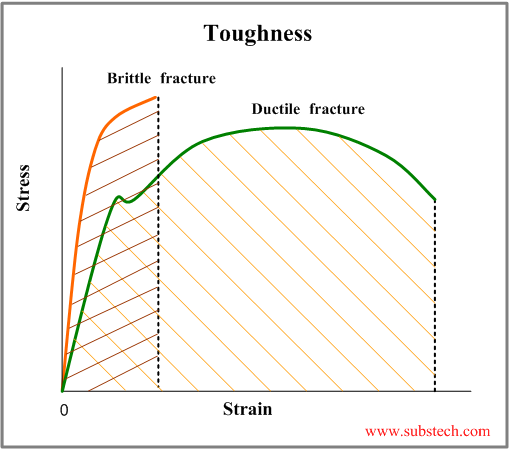
The area under each stress-strain curve represents the maximum energy that can be absorbed and is a measure of toughness.
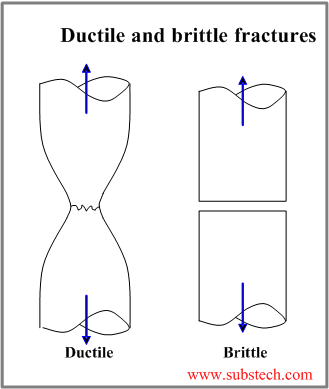
Ductile materials undergo observable plastic deformation and absorb significant energy before fracture. Brittle fracture is characterized by very low plastic deformation and low energy absorption prior to breaking.
Toughness is the ability of a material to absorb energy and plastically deform without fracturing. One definition of material toughness is the amount of energy per unit volume that a material can absorb before rupturing. This measure of toughness is different from that used for fracture toughness, which describes load bearing capabilities of materials with flaws.
Toughness requires a balance of strength and ductility. A material should withstand both high stresses and high strains in order to be tough. Generally, strength indicates how much force the material can support, while toughness indicates how much energy a material can absorb before rupturing.
Toughness (or, deformation energy, UT) is measured in units of joule per cubic metre (J·m−3) in the SI system and inch-pound-force per cubic inch (in·lbf·in−3) in US customary units.
_____________
Stress Strain Test Data Reference
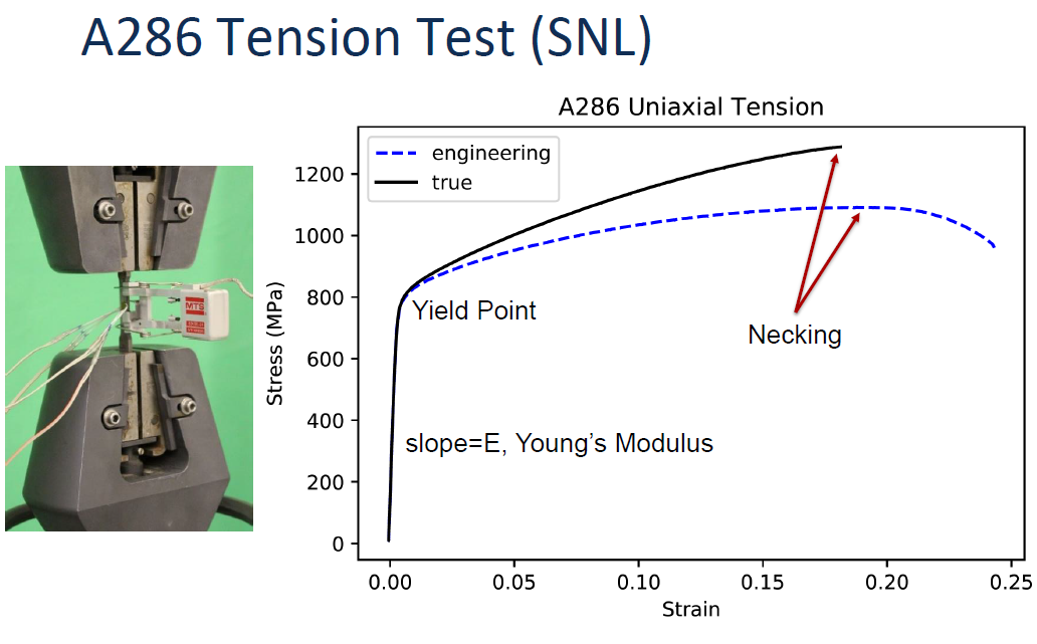
As an example, consider that a plate made from A286 Stainless Steel must withstand shock loading defined by the following acceleration shock response spectrum (SRS) and its corresponding pseudo velocity response spectrum. Note that A286 is a ductile material with excellent toughness.
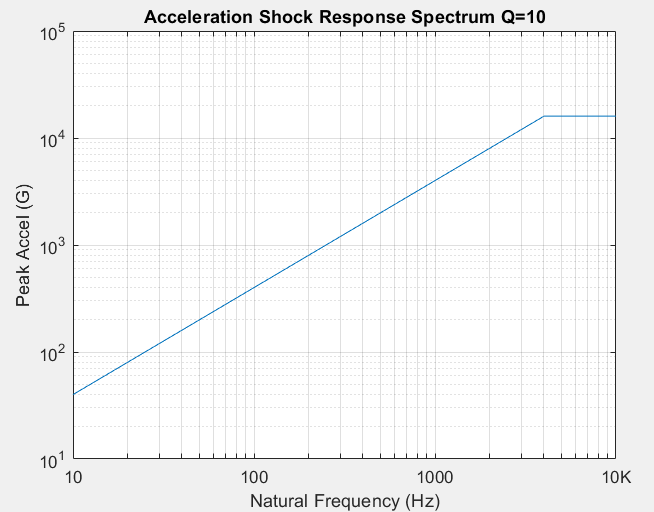
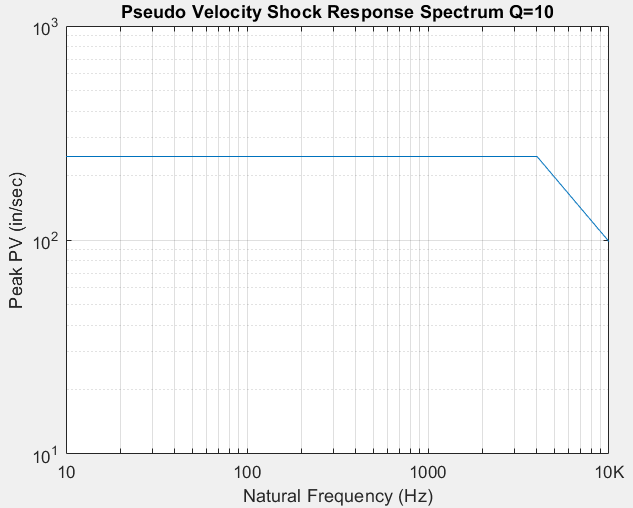
The conversion formula is: PV SRS (f) = scale*[Accel SRS (f) / (2 π f) ]
For English units: scale = 386 in/sec^2 / G
The natural frequency of the plate is unknown. So assume the peak pseudo velocity of 250 in/sec, which is the plateau.
The strain-velocity relationship for a plate is:
ε ~ 2 * ( PV / c ) = 2 * PV *sqrt( ρ / E )
c = sqrt ( E / ρ )
ε=strain
PV = pseudo velocity
c = speed of sound in the material
E = elastic modulus
ρ = mass/volume
The speed of sound in steel, aluminum and titanium is ~ 200,000 in/sec
The resulting strain for the plate is:
ε ~ 2 * ( PV / c ) ~ 2*(250 in/sec)/( 2e+05 in/sec) ~ 0.0025
This strain is approximately within the elastic range for the A286 stainless steel stress-strain curve.
Some caution is needed in applying this method too far into the plastic range due to the complexities of nonlinear behavior. Further research and material testing is needed.
___________________
Notes:
This approach is a rough approximation given that the shock response spectra curves assumed a linear model.
The elastic modulus is considered to be constant during plastic deformation as modeled by the stain hardening effect.
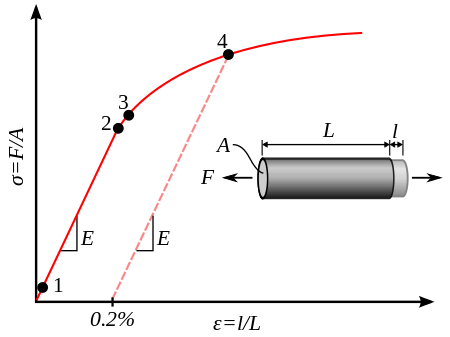
The yield point for engineering materials in general is defined as defined as the amount of stress that will result in a plastic strain of 0.2%, as indicated in point 4 in the above figure.
The speed of sound in the material has a very small change due to both elastic and plastic deformation. A number of papers have been written on the “acoustoelastic effect,” but they tend to theoretical.
____________________________________________________________________________________________
Material Stress Limits
The following is an excerpt from Reference 1 with some minor editing.
A material can sometimes sustain an important dynamic load without damage, whereas the same load, statically, would lead to plastic deformation or to failure. Many materials subjected to short duration loads have ultimate strengths higher than those observed when they are static.
Hopkinson noted that copper and steel wire can withstand stresses that are higher than their static elastic limit and are well beyond the static ultimate limit without separating proportionality between the stresses and the strains. This is provided that the length of time during which the stress exceeds the yield stress is of the order of 1 millisecond or less.
From tests carried out on steel (annealed steel with a low percentage of carbon) it was noted that the initiation of plastic deformation requires a definite time when stresses greater than the yield stress are applied. It was observed that this time can vary between 5 milliseconds (under a stress of approximately 352 MPa) and 6 seconds with approximately 255 MPa; with the static yield stress being equal to 214 MPa). Other tests carried out on five other materials showed that this delay exists only for materials for which the curve of static stress deformation presents a definite yield stress, and the plastic deformation then occurs for the load period.
|
Annealed Steel Test Results |
Stress |
Stress |
|---|---|---|
| Static Yield Stress |
214 |
31.1 |
| 6 sec for plastic deformation onset |
255 |
37.0 |
| 5 msec for plastic deformation onset |
352 |
51.1 |
Dynamic Strengthening of Materials
Reference 2 notes:
As far as steels and other metals are concerned, those with lower yield strength are usually more ductile than higher strength materials. That is, high yield strength materials tend to be brittle. Ductile (lower yield strength) materials are better able to withstand rapid dynamic loading than brittle (high yield strength) materials. Interestingly, during repeated dynamic loadings low yield strength ductile materials tend to increase their yield strength, whereas high yield strength brittle materials tend to fracture and shatter under rapid loading.
Reference 2 includes the following table where the data was obtained for uniaxial testing using an impact method.
|
Material |
Static Strength |
Dynamic Strength |
Impact Speed |
|---|---|---|---|
| 2024 Al (annealed) |
65,200 |
68,600 |
>200 |
| Magnesium Alloy |
43,800 |
51,400 |
>200 |
| Annealed Copper |
29,900 |
36,700 |
>200 |
| 302 Stainless Steel |
93,300 |
110,800 |
>200 |
| SAE 4140 Steel |
134,800 |
151,000 |
175 |
| SAE 4130 Steel |
80,000 |
440,000 |
235 |
| Brass |
39,000 |
310,000 |
216 |
References
- C. Lalanne, Sinusoidal Vibration (Mechanical Vibration and Shock), Taylor & Francis, New York, 1999.
- R. Huston and H. Josephs, Practical Stress Analysis in Engineering Design, Dekker, CRC Press, 2008. See Table 23.1.
Stress Strain Velocity Relationship Paper
– Tom Irvine
1 thought on “Material Shock Loading”