MEMS (Micro-Electro-Mechanical Systems) devices are miniature sensors or actuators fabricated using semiconductor manufacturing techniques, integrating microscopic mechanical structures and electronic circuitry on a single silicon chip. They use tiny moving elements such as beams, proof masses, diaphragms, or comb structures to sense or control physical quantities including acceleration, angular rate, pressure, vibration, force, and temperature, while providing high performance, low power consumption, small size, and high-volume manufacturability.
Developing Micro-Electromechanical Systems (MEMS) devices—such as inertial sensors, optical micro-mirror arrays, RF switches, and pressure transducers—for harsh shock environments presents unique qualification challenges.
A primary obstacle in ruggedized applications (such as heavy construction machinery, aerospace systems, downhole drilling, and defense) is characterizing micromechanical survivability over thousands or millions of high-acceleration shock cycles to map a device’s lifetime envelope. Because conventional electrodynamic shakers face a practical limitation of roughly 300 g for classical shock pulses, evaluating silicon microstructures at field levels of 750 g or higher requires specialized testing paradigms, advanced equipment, and physics-based damage acceleration models.
1. Beyond Peak Acceleration: Identifying the Governing Metrics
A foundational principle in hardware qualification is that external package acceleration ($g$-level) is rarely the best predictor of internal MEMS failure.
A MEMS element is a dynamic structure with internal natural frequencies typically ranging from several kilohertz to tens of kilohertz. The local quantities that actually govern mechanical damage accumulation include:
- Internal structural displacement and relative clearance limits.
- Peak stress within the silicon suspension beams, flexures, and anchors.
- Impact velocity of movable elements against internal travel stops or adjacent substrates.
- Contact force and local strain energy density during internal collisions.
Because of dynamic amplification, two shock pulses with the exact same 750 g peak acceleration can produce radically different internal responses depending on pulse duration and frequency content. For instance, a 750 g, 0.5 ms pulse may cause catastrophic failure if its frequency content excites the primary resonance of a MEMS cantilever, whereas a 2,000 g, 20 $\mu$s pulse might pass through the device with minimal internal displacement.
Environmental Characterization
Before establishing laboratory test profiles, the field environment should be characterized using:
- Shock Response Spectrum (SRS): To evaluate damage potential across the frequency domain. (include the Pseudo Velocity SRS)
- Pulse Duration and Repetition Distributions: To map the statistical frequency of high-energy events.
- Multi-axis Directionality: To account for the anisotropic nature of MEMS structural vulnerabilities.
2. High-g Shock Test Equipment Options
When conventional electrodynamic shakers reach their limits, specialized laboratory platforms must be utilized to accumulate high cycle counts at elevated acceleration levels.
Pneumatic and Gas-Gun Shock Machines
Pneumatic systems represent the most practical choice for high-throughput, repetitive shock testing of MEMS components.
- Capabilities: Capable of generating repeatable, controlled pulse shapes from 500 g to over 10,000 g.
- Throughput: Automated resetting mechanisms enable rapid cycling, allowing thousands of shocks to be accumulated efficiently.
- Applications: These platforms are widely utilized in ordnance and fuze qualification laboratories to simulate extreme mechanical environments.
Hopkinson (Kolsky) Bars
For ultra-high-g evaluation of high-frequency MEMS, Hopkinson bars provide a premier methodology.
- Capabilities: These systems generate precise, repeatable shock environments extending from 1,000 g to well over 50,000 g.
- Limitations: Pulse durations are inherently brief (typically tens to hundreds of microseconds). The resulting frequency content must be evaluated via SRS to ensure it matches the energy profile of the target application.
Mechanical Drop Tables and Resonant Beams
- Mechanical Drop Tables: Utilizing specialized programmers (such as high-durometer elastomer pads), commercial drop tables can achieve 500 g to 2,000 g profiles. However, cycle times may be limited by manual or semi-automated reset sequences.
- Pyroshock Simulators (Resonant Beams): Resonant beam systems excel at generating massive, high-frequency SRS amplitudes. These are highly effective if the dominant failure mode is driven by local stress-wave propagation rather than bulk package displacement.
3. Frameworks for Accelerating Shock Damage
Unlike classical metallic vibration fatigue, there is no universally accepted equivalent to Miner’s Rule or Basquin fatigue exponents for repetitive mechanical shock in silicon microstructures. Because failure mechanisms often compete, they must be decoupled and modeled independently.
A. Brittle Silicon Fracture (Stress-Driven)
Single-crystal and polycrystalline silicon exhibit negligible plasticity and behave as brittle materials governed by fracture mechanics.
- Modeling Approach: Rather than using a classical S-N curve, reliability should be mapped using Weibull Statistics combined with peak stress estimates.
- Acceleration Strategy: Testing components at three or four distinct, elevated g-levels allows the probability of structural fracture to be plotted over time, defining the statistical survivability envelope.
B. Impact Damage and Wear (Velocity-Driven)
When external shock causes a movable MEMS structure to repeatedly impact travel stops or adjacent layers, degradation accumulates via micro-cracking, surface pitting, and debris generation.
- Modeling Approach: Damage in this regime is modeled as a function of internal impact velocity rather than external package acceleration:
$$\text{Damage} \propto N \times V^m$$
Where $N$ is the number of cycles, $V$ is the internal impact velocity, and $m$ is an experimentally derived exponent.
- Acceleration Strategy: Finite element analysis (FEA) or reduced-order analytical models can correlate package-level shock to internal microstructure impact velocity, allowing shorter test sequences at higher velocities to simulate extended field lifespans.
C. Stiction (Threshold and Environmental Phenomenon)
Stiction often functions as a threshold or latching failure rather than a gradual wear process. High-g shocks can force a compliant microstructure past its restorative spring thresholds, or degrade anti-stiction coatings via contact impact, allowing capillary, triboelectric, or Van der Waals forces to lock the structure.
- Acceleration Strategy: Because mechanical shock alone rarely captures full stiction behavior, combined-environment testing is critical. Introducing elevated humidity and temperature cycling alongside repetitive shock testing accelerates coating degradation and surface adhesion far more effectively than increasing acceleration levels alone.
D. Component Wear Processes
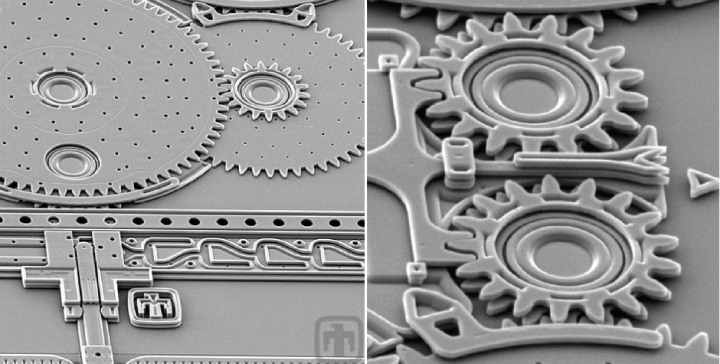
For internal rubbing or sliding components—such as micro-gears, hinges, or bistable switches—classical wear models apply:
$$\text{Wear} \propto \text{Load} \times \text{Sliding Distance}$$
This framework enables accelerated testing by structurally increasing contact forces to compress the time required to observe wear-related failures.
4. Unifying Data via the Stress-Velocity Relationship
To establish a consistent metric for curve-fitting and data extrapolation across diverse MEMS devices, wave propagation theory offers a valuable alternative to standard acceleration metrics. The fundamental relationship dictates that dynamic stress ($\sigma$) in an elastic structure is directly proportional to material particle velocity ($V$):
$$\sigma = \rho c V$$
Where $\rho$ is the material density and $c$ is the wave propagation velocity.
Velocity serves as a highly direct indicator of internal stress and structural damage. External package shock induces a velocity change ($\Delta V$), which transmits through the die attach and substrate to produce internal strain energy:
$$\Delta V = \int a(t) \, dt$$
Implementing Pseudo-Velocity Shock Response Spectrum (PVSRS)
Instead of plotting cycle-to-failure data against peak acceleration, reliability data can be analyzed using the Pseudo-Velocity Shock Response Spectrum (PVSRS). Plotting Cycles-to-Failure vs. Peak Pseudo-Velocity frequently collapses scattered data points from disparate pulse widths and amplitudes onto a consistent, unified empirical curve. This velocity-based framework provides a physics-backed methodology to extrapolate low-g shaker data up to high-g field requirements, regardless of whether the device under test is an inertial sensor or an optical array.
5. Is There a Universal Pseudo-Velocity Threshold for MEMS?
Engineers familiar with military standards like MIL-STD-810 often rely on the historical empirical rule of thumb for macro-structures: a pseudo-velocity threshold of 50 inches per second (ips) implies a non-damaging shock environment, while 100 ips marks the boundary for potential structural damage.
These legacy thresholds do not directly translate to MEMS devices. For a macro-scale assembly composed of steel or aluminum, a particle velocity of roughly 130 ips generates dynamic stresses that equal the material’s yield point—hence the conservative 50 ips safety ceiling. However, the unique micro-scale physics of silicon demand an entirely different threshold paradigm split into two distinct architecture classes:
Class 1: Open-Volume / Touchdown MEMS (Stiction & Impact Limited)
If the MEMS device features moving elements designed to actuate or flex through a gap (such as gyroscopes, micro-mirrors, and RF switches), the device threshold is limited by internal collision mechanics, not structural fracture.
- The Threshold Range: 10 to 50 ips (0.25 to 1.25 m/s)
- The Physics: While a 50 ips velocity change will not fracture the silicon, the relative microstructure displacement ($Z = PV/\omega$) is often enough to drive the element into a hard touchdown against adjacent layers. This interface impact compromises anti-stiction coatings and generates debris, bringing about rapid stiction failures.
Class 2: Solid-State / High-Stiffness MEMS (Fracture Limited)
If the MEMS architecture features exceptionally high mechanical spring rates, minute travel clearances, or bulk-etched rigid designs (such as specialized ballistic accelerometers or bulk acoustic wave resonators), it is strictly limited by brittle fracture.
- The Threshold Range: 200 to 1,000+ ips (5 to 25+ m/s)
- The Physics: Micro-scale silicon boasts an ultimate tensile strength up to $1.5 \text{ to } 3 \text{ GPa}$ and lacks macro-scale structural defects. These devices easily tolerate massive velocity shifts. A pseudo-velocity must usually exceed several hundred ips before the localized stress concentrations ($\sigma = \rho c V \cdot K_t$) approach the threshold required to initiate brittle cleavage in silicon.
6. Structuring a Qualification Protocol
A robust test program for high-g, high-cycle MEMS qualification should follow a structured sequence:
- Field Data Analysis: Quantify the operational environment by converting field time histories into both Acceleration SRS and Pseudo-Velocity SRS.
- Failure Isolation: Perform destructive physical analysis to isolate the dominant root cause (e.g., structural fracture, travel-stop wear, or environment-driven stiction).
- Analytical Modeling: Utilize FEA or spring-mass-damper simulations to map external package acceleration to internal structural stress and microstructural velocity.
- Multi-Level Empirical Testing: Execute automated, high-cycle testing matrices across at least three to four distinct acceleration amplitudes using appropriate shock machinery.
- Statistical Curve Fitting: Fit experimental lifecycles to a Weibull distribution for fracture limits, and apply a velocity-based power-law model for internal impact wear.
Shifting the primary damage metric from package-level acceleration to internal stress and pseudo-velocity provides a repeatable, physics-based methodology for predicting the long-term reliability of MEMS devices in extreme environments.
– Tom Irvine