Benford’s law, also known as the Newcomb–Benford law, the law of anomalous numbers, or the first-digit law, is an observation that in many real-life sets of numerical data, the leading digit is likely to be small. In sets that obey the law, the number 1 appears as the leading significant digit about 30% of the time, while 9 appears as the leading significant digit less than 5% of the time. If the digits were distributed uniformly, they would each occur about 11.1% of the time.
The occurrence frequency of the leading digit is somehow logarithmic.
Not every data set satisfies Benford’s law.
Benford’s law tends to be best suited to:
- Quantitative, random data
- Data that are measured rather than assigned
- Ranges over orders of magnitudes
- Not artificially restricted by minimums or maximums
- Mixed populations
- Larger datasets are better
As an experiment, I generated two million points in Matlab to simulate a stationary signal with randomly-varying amplitude and with normal distribution. The mean value was zero. The standard deviation was one million. I then made a histogram of the first digit of each absolute instantaneous amplitude point. The objective was to determine whether the first digit histogram would match the Benford pattern. The results of the normal random signal was similar to Benford but with some variation as shown in the table below.
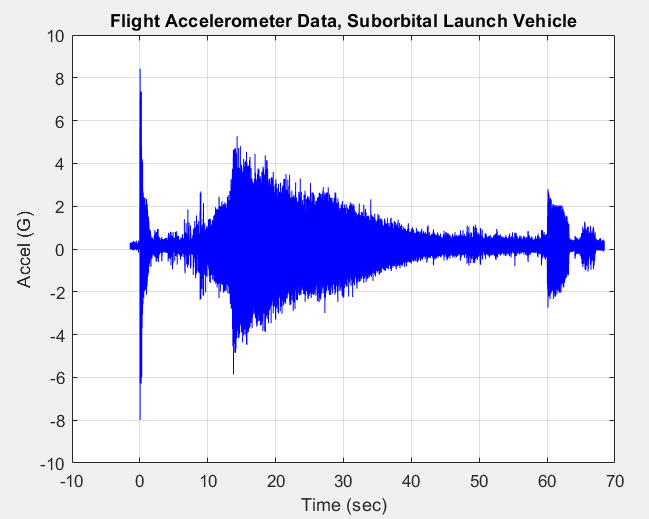
I also took some nonstationary flight accelerometer data from an unmanned, suborbital launch vehicle, as shown in the figure above. The data had 453,250 points. I multiplied the amplitude by one million to achieved the desired multiple orders of magnitude effect. The nonstationary results had good agreement with Benford.
| First Digit | Benford Histogram | Normal Random Signal Histogram | Nonstationary Flight Data Histogram |
| 1 | 30.1% | 36.0% | 33.7% |
| 2 | 17.6% | 12.9% | 19.2% |
| 3 | 12.5% | 8.7% | 12.1% |
| 4 | 9.7% | 8.1% | 8.4% |
| 5 | 7.9% | 7.8% | 6.6% |
| 6 | 6.7% | 7.3% | 5.7% |
| 7 | 5.8% | 6.9% | 5.1% |
| 8 | 5.1% | 6.5% | 4.7% |
| 9 | 4.6% | 6.0% | 4.5% |
Further research is needed to determine whether this Benford comparison is useful for vibration analysis.
– Tom Irvine
Hi Tom,
Interesting! I tried on the vertical railway track irregularity data generated from German code, it basically fulfills Benford’s law.