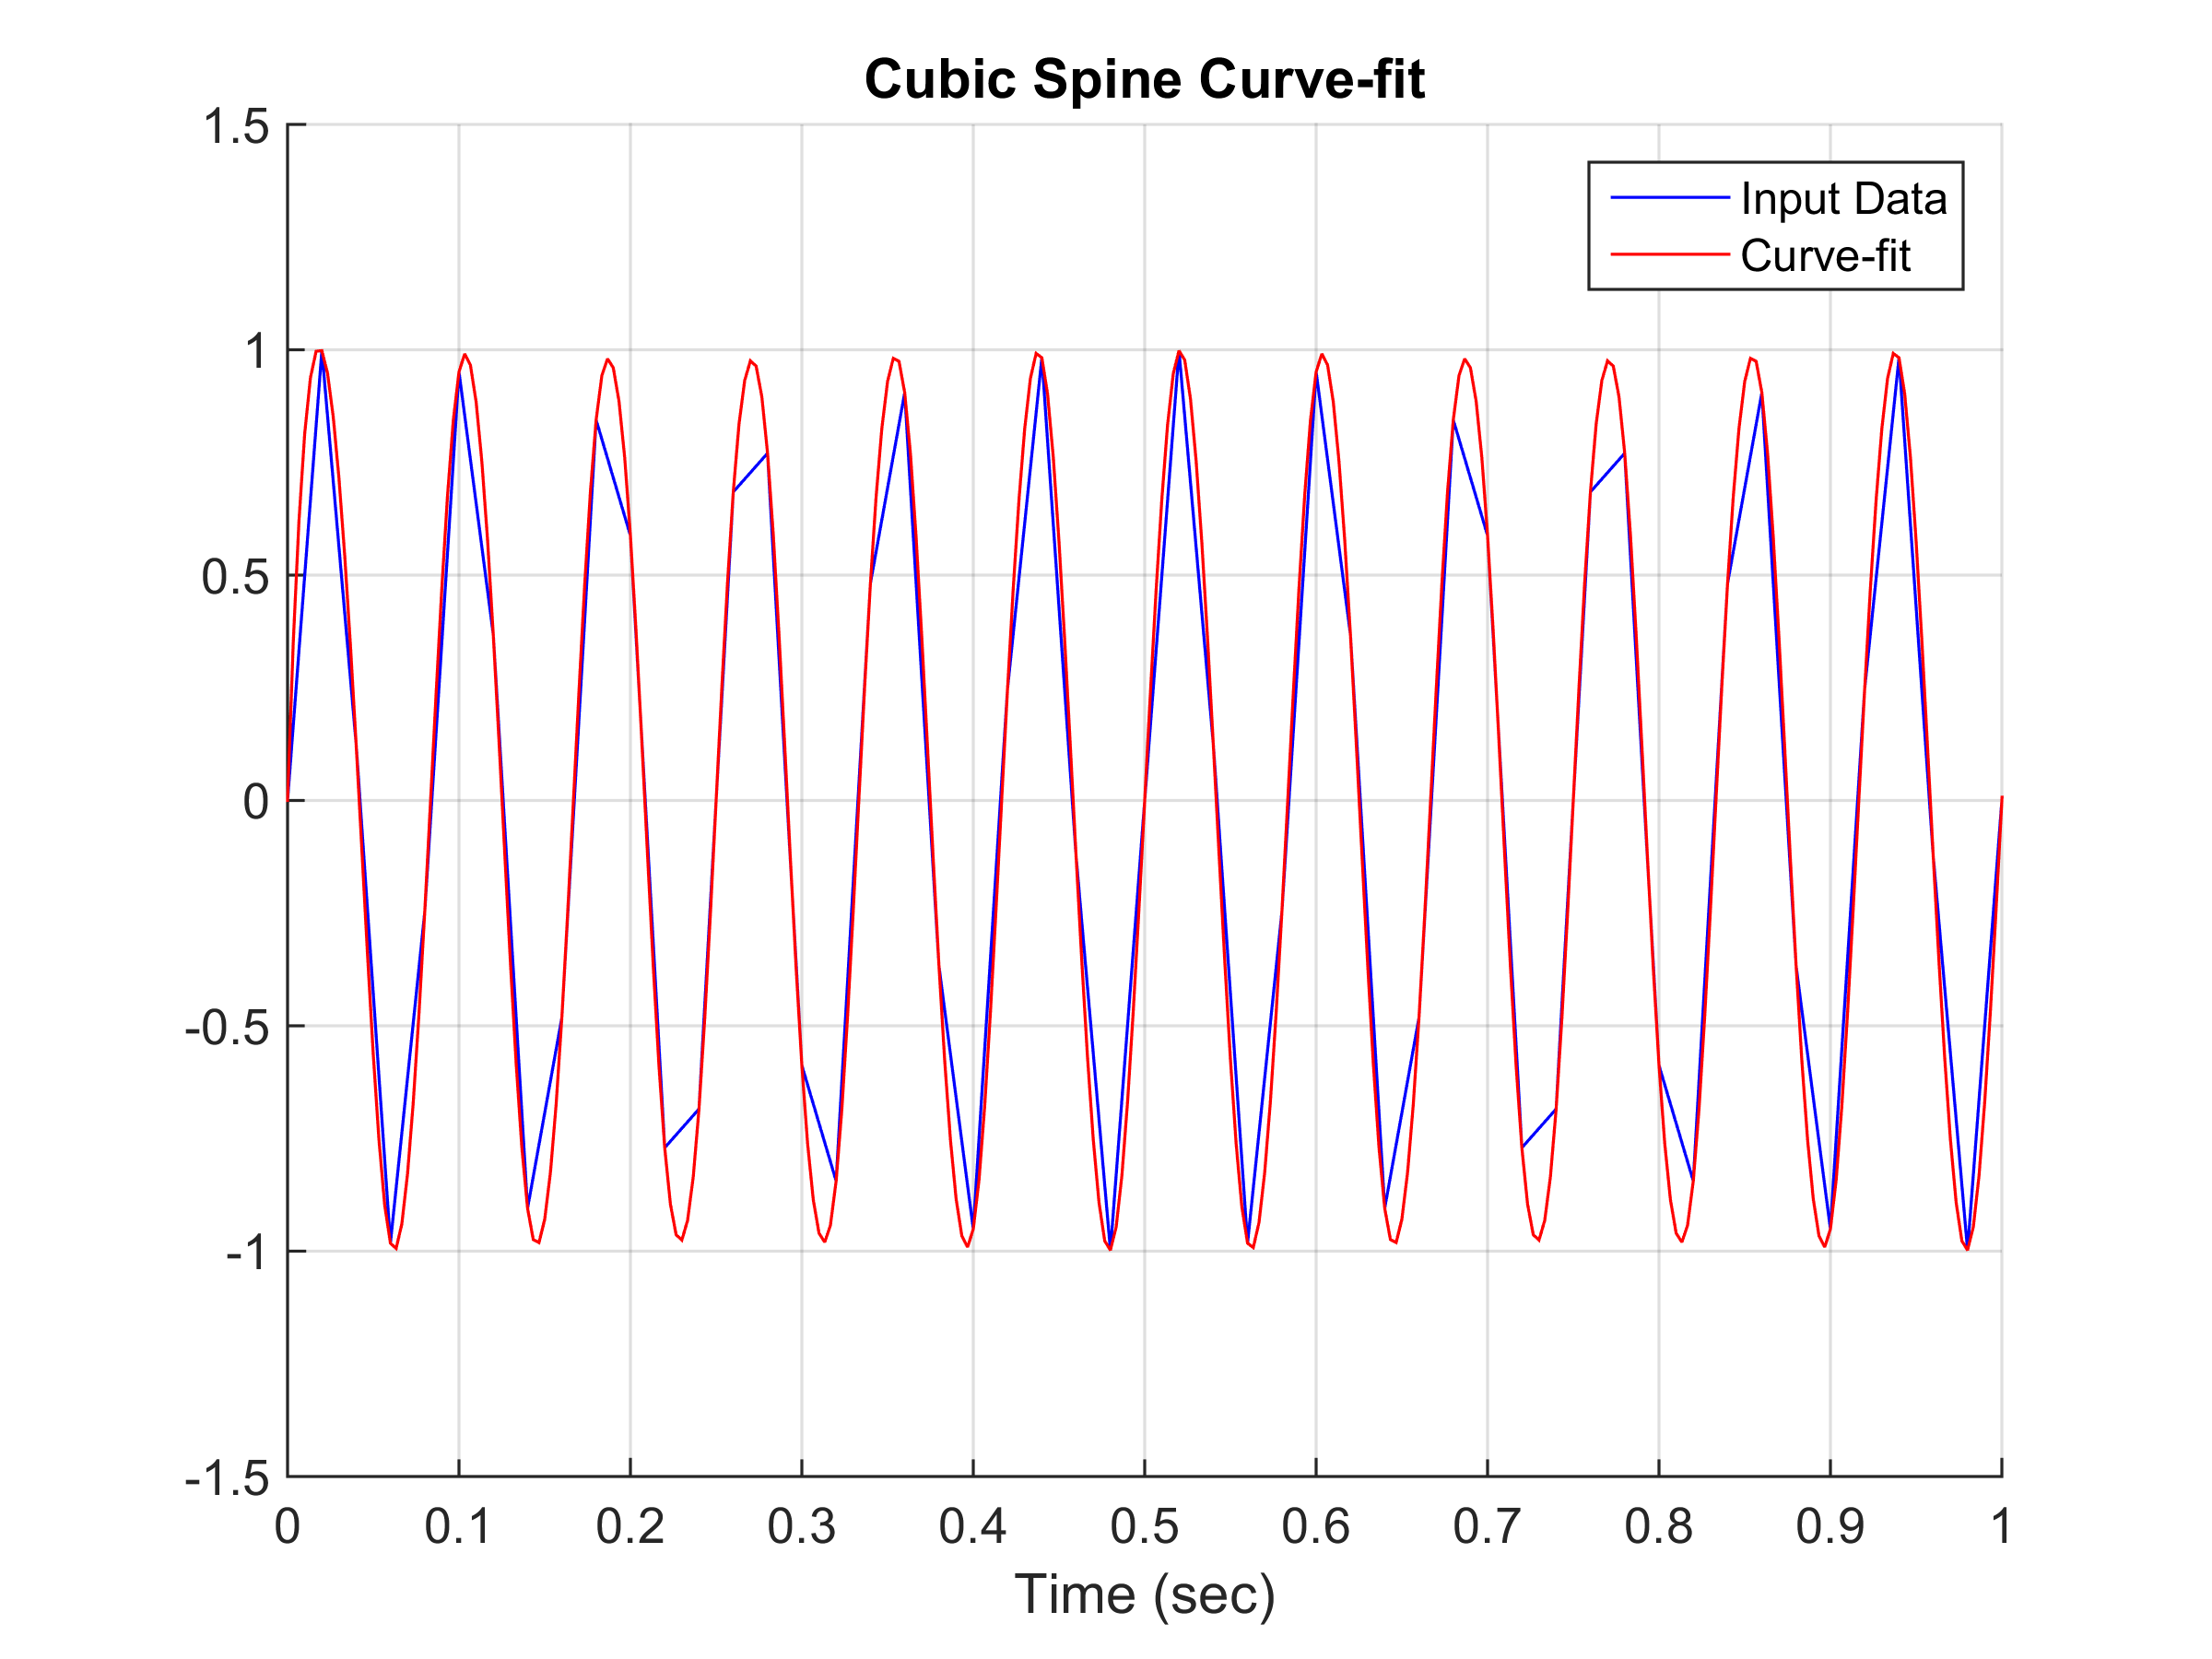
In some cases, the sampling rate of measured data needs to be increased, particularly for time domain analysis. One method is do a cubic spline curve-fit. This is an “engineering judgment” process with some limitations.
The “Input Data” in the figure above is a 12 Hz sine function with unit amplitude which was sampled at 50 Hz, which yields 4.2 points per cycle. The sample rate should be at least 10 times the highest frequency of interest in the measured data for time domain analysis.
The curve-fit was performed at 300 Hz. The resulting curve is very close to the expected signal.
This curve-fit option is given in the package at:
Matlab script: Vibrationdata Signal Analysis Package
vibrationdata > Signal Editing Utilities > Cubic Spline Curve-fit
The usual precautions should be taken when measuring data such as using an analog anti-aliasing filter with the proper lowpass frequency. See Aliasing References
– Tom Irvine